
Page 232 - Multidimensional Chromatography
P. 232
226 Multidimensional Chromatography
Auxiliary gas
PR2
Carrier gas SV2 SV4
He FID3
NV− NV+
PR1 Open split 46
Furnace 45
SV1 Cryogenic 44
Injector trap
Ion source
Column 1 FID1 FID2 Column 2 He
Split Live-T
Switching device SV3
CO 2
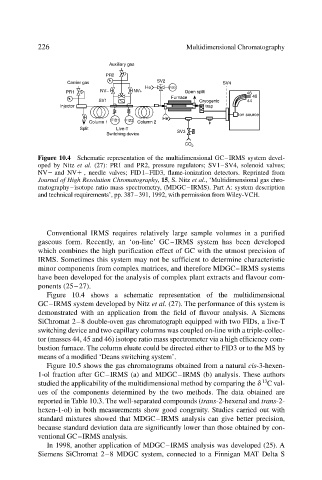
Figure 10.4 Schematic representation of the multidimensional GC–IRMS system devel-
oped by Nitz et al. (27): PR1 and PR2, pressure regulators; SV1–SV4, solenoid valves;
NV and NV , needle valves; FID1–FID3, flame-ionization detectors. Reprinted from
Journal of High Resolution Chromatography, 15, S. Nitz et al., ‘Multidimensional gas chro-
matography–isotope ratio mass spectrometry, (MDGC–IRMS). Part A: system description
and technical requirements’, pp. 387–391, 1992, with permission from Wiley-VCH.
Conventional IRMS requires relatively large sample volumes in a purified
gaseous form. Recently, an ‘on-line’ GC–IRMS system has been developed
which combines the high purification effect of GC with the utmost precision of
IRMS. Sometimes this system may not be sufficient to determine characteristic
minor components from complex matrices, and therefore MDGC–IRMS systems
have been developed for the analysis of complex plant extracts and flavour com-
ponents (25–27).
Figure 10.4 shows a schematic representation of the multidimensional
GC–IRMS system developed by Nitz et al. (27). The performance of this system is
demonstrated with an application from the field of flavour analysis. A Siemens
SiChromat 2–8 double-oven gas chromatograph equipped with two FIDs, a live-T
switching device and two capillary columns was coupled on-line with a triple-collec-
tor (masses 44, 45 and 46) isotope ratio mass spectrometer via a high efficiency com-
bustion furnace. The column eluate could be directed either to FID3 or to the MS by
means of a modified ‘Deans switching system’.
Figure 10.5 shows the gas chromatograms obtained from a natural cis-3-hexen-
1-ol fraction after GC–IRMS (a) and MDGC–IRMS (b) analysis. These authors
13
studied the applicability of the multidimensional method by comparing the C val-
ues of the components determined by the two methods. The data obtained are
reported in Table 10.3. The well-separated compounds (trans-2-hexenal and trans-2-
hexen-1-ol) in both measurements show good congruity. Studies carried out with
standard mixtures showed that MDGC–IRMS analysis can give better precision,
because standard deviation data are significantly lower than those obtained by con-
ventional GC–IRMS analysis.
In 1998, another application of MDGC–IRMS analysis was developed (25). A
Siemens SiChromat 2–8 MDGC system, connected to a Finnigan MAT Delta S