
Page 406 - Multidimensional Chromatography
P. 406
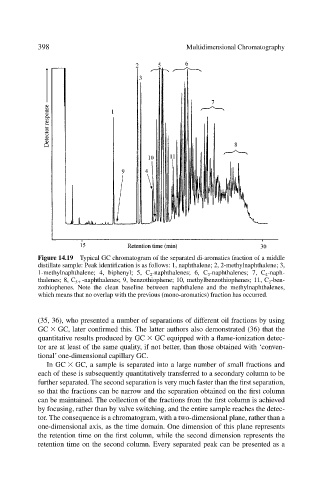
398                                     Multidimensional Chromatography


                           Figure 14.19 Typical GC chromatogram of the separated di-aromatics fraction of a middle
                           distillate sample: Peak identification is as follows: 1, naphthalene; 2, 2-methylnaphthalene; 3,
                           1-methylnaphthalene; 4, biphenyl; 5, C 2 -naphthalenes; 6, C 3 -naphthalenes; 7, C 4 -naph-
                           thalenes; 8, C 5  -naphthalenes; 9, benzothiophene; 10, methylbenzothiophenes; 11, C 2 -ben-
                           zothiophenes. Note the clean baseline between naphthalene and the methylnaphthalenes,
                           which means that no overlap with the previous (mono-aromatics) fraction has occurred.


                           (35, 36), who presented a number of separations of different oil fractions by using
                           GC
 GC, later confirmed this. The latter authors also demonstrated (36) that the
                           quantitative results produced by GC
 GC equipped with a flame-ionization detec-
                           tor are at least of the same quality, if not better, than those obtained with ‘conven-
                           tional’ one-dimensional capillary GC.
                             In GC
 GC, a sample is separated into a large number of small fractions and
                           each of these is subsequently quantitatively transferred to a secondary column to be
                           further separated. The second separation is very much faster than the first separation,
                           so that the fractions can be narrow and the separation obtained on the first column
                           can be maintained. The collection of the fractions from the first column is achieved
                           by focusing, rather than by valve switching, and the entire sample reaches the detec-
                           tor. The consequence is a chromatogram, with a two-dimensional plane, rather than a
                           one-dimensional axis, as the time domain. One dimension of this plane represents
                           the retention time on the first column, while the second dimension represents the
                           retention time on the second column. Every separated peak can be presented as a