
Page 407 - Multidimensional Chromatography
P. 407
Multidimensional Chromatographic Applications in the Oil Industry 399
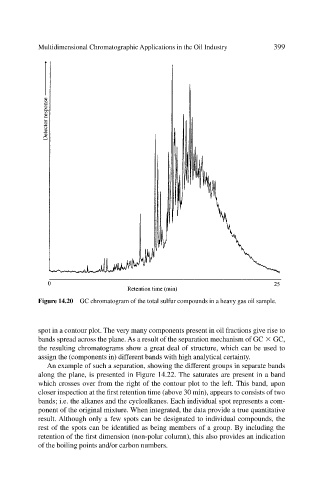
Figure 14.20 GC chromatogram of the total sulfur compounds in a heavy gas oil sample.
spot in a contour plot. The very many components present in oil fractions give rise to
bands spread across the plane. As a result of the separation mechanism of GC
GC,
the resulting chromatograms show a great deal of structure, which can be used to
assign the (components in) different bands with high analytical certainty.
An example of such a separation, showing the different groups in separate bands
along the plane, is presented in Figure 14.22. The saturates are present in a band
which crosses over from the right of the contour plot to the left. This band, upon
closer inspection at the first retention time (above 30 min), appears to consists of two
bands; i.e. the alkanes and the cycloalkanes. Each individual spot represents a com-
ponent of the original mixture. When integrated, the data provide a true quantitative
result. Although only a few spots can be designated to individual compounds, the
rest of the spots can be identified as being members of a group. By including the
retention of the first dimension (non-polar column), this also provides an indication
of the boiling points and/or carbon numbers.