
Page 424 - Multidimensional Chromatography
P. 424
416 Multidimensional Chromatography
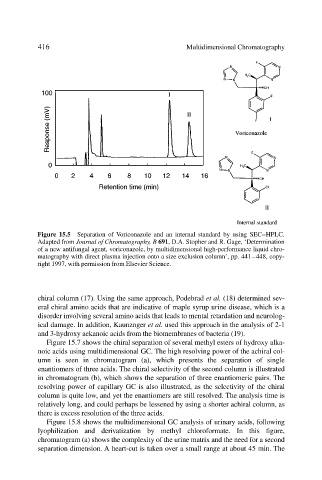
Figure 15.5 Separation of Voriconazole and an internal standard by using SEC–HPLC.
Adapted from Journal of Chromatography, B 691, D.A. Stopher and R. Gage, ‘Determination
of a new antifungal agent, voriconazole, by multidimensional high-performance liquid chro-
matography with direct plasma injection onto a size exclusion column’, pp. 441–448, copy-
right 1997, with permission from Elsevier Science.
chiral column (17). Using the same approach, Podebrad et al. (18) determined sev-
eral chiral amino acids that are indicative of maple syrup urine disease, which is a
disorder involving several amino acids that leads to mental retardation and neurolog-
ical damage. In addition, Kaunznger et al. used this approach in the analysis of 2-1
and 3-hydroxy aekanoic acids from the biomembranes of bacteria (19).
Figure 15.7 shows the chiral separation of several methyl esters of hydroxy alka-
noic acids using multidimensional GC. The high resolving power of the achiral col-
umn is seen in chromatogram (a), which presents the separation of single
enantiomers of three acids. The chiral selectivity of the second column is illustrated
in chromatogram (b), which shows the separation of three enantiomeric pairs. The
resolving power of capillary GC is also illustrated, as the selectivity of the chiral
column is quite low, and yet the enantiomers are still resolved. The analysis time is
relatively long, and could perhaps be lessened by using a shorter achiral column, as
there is excess resolution of the three acids.
Figure 15.8 shows the multidimensional GC analysis of urinary acids, following
lyophilization and derivatization by methyl chloroformate. In this figure,
chromatogram (a) shows the complexity of the urine matrix and the need for a second
separation dimension. A heart-cut is taken over a small range at about 45 min. The