
Page 104 - Book Hosokawa Nanoparticle Technology Handbook
P. 104
FUNDAMENTALS CH. 2 STRUCTURAL CONTROL OF NANOPARTICLES
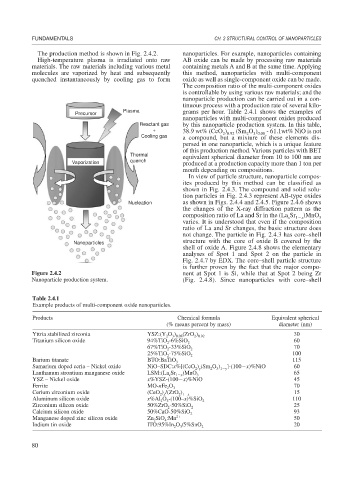
The production method is shown in Fig. 2.4.2. nanoparticles. For example, nanoparticles containing
High-temperature plasma is irradiated onto raw AB oxide can be made by processing raw materials
materials. The raw materials including various metal containing metals A and B at the same time. Applying
molecules are vaporized by heat and subsequently this method, nanoparticles with multi-component
quenched instantaneously by cooling gas to form oxide as well as single-component oxide can be made.
The composition ratio of the multi-component oxides
is controllable by using various raw materials; and the
nanoparticle production can be carried out in a con-
tinuous process with a production rate of several kilo-
Plasma
Precursor grams per hour. Table 2.4.1 shows the examples of
nanoparticles with multi-component oxides produced
Reactant gas by this nanoparticle production system. In this table,
+ 38.9 wt% (CeO ) (Sm O ) - 61.1wt% NiO is not
2
3 0.08
2 0.92
Cooling gas a compound, but a mixture of these elements dis-
persed in one nanoparticle, which is a unique feature
of this production method. Various particles with BET
Thermal equivalent spherical diameter from 10 to 100 nm are
Vaporization quench produced at a production capacity more than 1 ton per
month depending on compositions.
In view of particle structure, nanoparticle compos-
ites produced by this method can be classified as
shown in Fig. 2.4.3. The compound and solid solu-
tion particles in Fig. 2.4.3 represent AB-type oxides
Nucleation as shown in Figs. 2.4.4 and 2.4.5. Figure 2.4.6 shows
the changes of the X-ray diffraction pattern as the
composition ratio of La and Sr in the (La Sr 1 x )MnO 3
x
varies. It is understood that even if the composition
ratio of La and Sr changes, the basic structure does
not change. The particle in Fig. 2.4.3 has core–shell
Nanoparticles structure with the core of oxide B covered by the
shell of oxide A. Figure 2.4.8 shows the elementary
analyses of Spot 1 and Spot 2 on the particle in
Fig. 2.4.7 by EDX. The core–shell particle structure
is further proven by the fact that the major compo-
Figure 2.4.2 nent at Spot 1 is Si, while that at Spot 2 being Zr
Nanoparticle production system. (Fig. 2.4.8). Since nanoparticles with core–shell
Table 2.4.1
Example products of multi-component oxide nanoparticles.
Products Chemical formula Equivalent spherical
(% means percent by mass) diameter (nm)
Yttria stabilized zirconia YSZ:(Y O ) (ZrO ) 30
3 0.08
2 0.92
2
Titanium silicon oxide 94%TiO -6%SiO 2 60
2
67%TiO -33%SiO 2 70
2
25%TiO -75%SiO 2 100
2
Barium titanate BTO:BaTiO 3 115
Samarium doped ceria – Nickel oxide NiO–SDC:x%[(CeO ) (Sm O ) ]-(100 x)%NiO 60
3 1 y
2
2 y
Lanthanum strontium manganese oxide LSM:(La Sr 1 x )MnO 3 65
x
YSZ – Nickel oxide x%YSZ-(100 x)%NiO 45
Ferrite MO-nFe O 3 70
2
Cerium zirconium oxide (CeO ) /(ZrO ) 15
2 x
2 1 x
Aluminum silicon oxide x%Al O -(100–x)%SiO 2 110
3
2
Zirconium silicon oxide 50%ZrO -50%SiO 2 25
2
Calcium silicon oxide 50%CaO-50%SiO 2 93
Manganese doped zinc silicon oxide Zn SiO :Mn 2 50
2
4
Indium tin oxide ITO:95%In O /5%SnO 2 20
3
2
80