
Page 140 - Book Hosokawa Nanoparticle Technology Handbook
P. 140
FUNDAMENTALS CH. 3 CHARACTERISTICS AND BEHAVIOR OF NANOPARTICLES AND ITS DISPERSION SYSTEMS
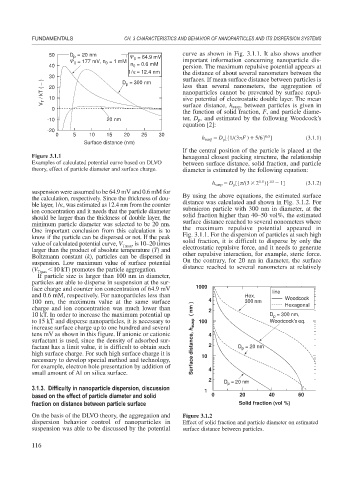
50 D = 20 nm = 64.9 mV curve as shown in Fig. 3.1.1. It also shows another
p
= 177 mV, n = 1 mM 0 important information concerning nanoparticle dis-
0
0
40 n = 0.6 mM persion. The maximum repulsive potential appears at
0
1/κ = 12.4 nm the distance of about several nanometers between the
30 D = 300 nm surfaces. If mean surface distance between particles is
V T / kT ( − ) 20 less than several nanometers, the aggregation of
p
nanoparticles cannot be prevented by surface repul-
10
sive potential of electrostatic double layer. The mean
0 surface distance, h susp, between particles is given in
the function of solid fraction, F, and particle diame-
-10 20 nm ter, D p, and estimated by the following Woodcock’s
equation [2]:
-20
0 5 10 15 20 25 30
0.5
h susp D [{1/(3 F ) 5/6} ] (3.1.1)
p
Surface distance (nm)
If the central position of the particle is placed at the
Figure 3.1.1 hexagonal closest packing structure, the relationship
Examples of calculated potential curve based on DLVO between surface distance, solid fraction, and particle
theory, effect of particle diameter and surface charge. diameter is estimated by the following equation:
0.5
1/3
h susp D [{ /(3 2 )} 1] (3.1.2)
p
suspension were assumed to be 64.9 mV and 0.6 mM for
the calculation, respectively. Since the thickness of dou- By using the above equations, the estimated surface
ble layer, 1/ , was estimated as 12.4 nm from the counter distance was calculated and shown in Fig. 3.1.2. For
ion concentration and it needs that the particle diameter submicron particle with 300 nm in diameter, at the
should be larger than the thickness of double layer, the solid fraction higher than 40–50 vol%, the estimated
minimum particle diameter was selected to be 20 nm. surface distance reached to several nonometers where
One important conclusion from this calculation is to the maximum repulsive potential appeared in
know if the particle can be dispersed or not. If the peak Fig. 3.1.1. For the dispersion of particles at such high
value of calculated potential curve, V Tmax , is 10–20 times solid fraction, it is difficult to disperse by only the
larger than the product of absolute temperature (T) and electrostatic repulsive force, and it needs to generate
Boltzmann constant (k), particles can be dispersed in other repulsive interaction, for example, steric force.
suspension. Low maximum value of surface potential On the contrary, for 20 nm in diameter, the surface
(V Tmax 10 kT) promotes the particle aggregation. distance reached to several nanometers at relatively
If particle size is larger than 100 nm in diameter,
particles are able to disperse in suspension at the sur-
face charge and counter ion concentration of 64.9 mV 1000 line
and 0.6 mM, respectively. For nanoparticles less than Hex. Woodcock
100 nm, the maximum value at the same surface 4 300 nm Hexagonal
charge and ion concentration was much lower than 2
10 kT. In order to increase the maximum potential up D = 300 nm,
p
to 15 kT and disperse nanoparticles, it is necessary to 100 Woodcock's eq.
increase surface charge up to one hundred and several
tens mV as shown in this figure. If anionic or cationic 4
surfactant is used, since the density of adsorbed sur- Surface distance, h susp ( nm )
factant has a limit value, it is difficult to obtain such 2 D = 20 nm
p
high surface charge. For such high surface charge it is 10
necessary to develop special method and technology,
for example, electron hole presentation by addition of 4
small amount of Al on silica surface.
2
D = 20 nm
p
3.1.3. Difficulty in nanoparticle dispersion, discussion
1
based on the effect of particle diameter and solid 0 20 40 60
fraction on distance between particle surface Solid fraction (vol %)
On the basis of the DLVO theory, the aggregation and Figure 3.1.2
dispersion behavior control of nanoparticles in Effect of solid fraction and particle diameter on estimated
suspension was able to be discussed by the potential surface distance between particles.
116