
Page 154 - Book Hosokawa Nanoparticle Technology Handbook
P. 154
FUNDAMENTALS CH. 3 CHARACTERISTICS AND BEHAVIOR OF NANOPARTICLES AND ITS DISPERSION SYSTEMS
If the Hamaker constant A is between A and A , For more quantitative estimation, a method using a
11
22
33
the resulting Hamaker constant A 132 is negative. Thus, root mean square roughness is proposed [12, 13]. To
the two bodies of materials 1 and 2 experience repul- reduce the van der Waals force through the use of the
sive force. The Hamaker constants in air are almost roughness, nanoparticles are added on the surface of
the same as those in vacuum. However, when water primary particles. This method is widely used in vari-
caused by capillary condensation exists between the ous fields because of the simplicity and effectiveness.
surfaces, the effect of the medium 3 should be taken For large surface roughness, the radius of curvature
into consideration [6]. of asperity summits should also be taken into account
The attractive force increases as the separation dis- for the estimation of the van der Waals force. [14]. In
tance decreases as in equation (3.5.1). However, when addition, particles of irregular shape or complicated
the distance is very small, the electron clouds of atoms surface shape contact at different points on the sur-
on the surfaces overlap, and a strong repulsive force acts face, and therefore the total force of the adhesion
on the surfaces, which is known as Born repulsion [1]. should be calculated by summing the force compo-
Therefore, there is a stable separation distance z. In gen- nents in the direction of the adhesion.
eral, z 0.4 nm is used for smooth surfaces in gases [7]. In general, particles elastically deform under an
On the other hand, when the surfaces are an appre- applied force if the load is small. The deformation of
ciable distance apart, the van der Waals force becomes a spherical particle can be analyzed by the Hertz the-
smaller than the value calculated by equation (3.5.1). ory [15]. In order to clarify the relationship between
This is because the finite speed of light causes a phase the adhesive force and the deformation, several mod-
lag in the charge fluctuation interaction between atoms els based on the Hertz theory were proposed. The JKR
or molecules. This is referred to as the retardation theory, developed by Johnson, Kendall and Roberts
effect [1, 8, 9]. At distances beyond about 5 nm, the [16], gives the following equation relating the exter-
van der Waals force begins to decrease more rapidly, nal compressive force F and the van der Waals force
and at 100 nm separation, the retarded van der Waals to the radius of the contact area a.
force is about one order smaller than the non-retarded
one. Therefore, over 100 nm separation, the van der ⎡ ⎛ Ad ⎞ 2 ⎤
Waals force is negligibly small compared to other a 3 kd ⎢ F Ad Ad F ⎜ 2 ⎟ ⎥ (3.5.8)
3
forces exerted on the surfaces. 8 ⎢ ⎣ z 8 2 z 4 2 ⎝ z 8 ⎠ ⎥ ⎦
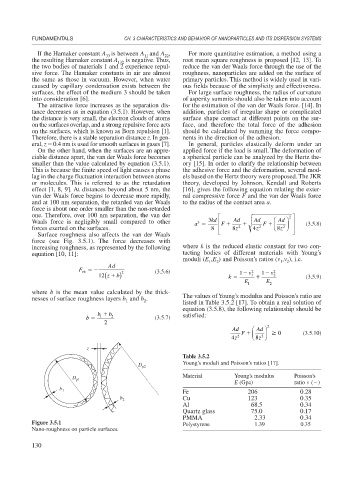
Surface roughness also affects the van der Waals
force (see Fig. 3.5.1). The force decreases with
increasing roughness, as represented by the following where k is the reduced elastic constant for two con-
equation [10, 11]: tacting bodies of different materials with Young’s
moduli (E ,E ) and Poisson’s ratios ( , ), i.e.
1
1
2
2
Ad
F
12( z b) 2 (3.5.6) k 1 2 1 1 2 2 (3.5.9)
vb
E 1 E 2
where b is the mean value calculated by the thick-
nesses of surface roughness layers b and b . The values of Young’s modulus and Poisson’s ratio are
2
1
listed in Table 3.5.2 [17]. To obtain a real solution of
equation (3.5.8), the following relationship should be
b b satisfied:
b 1 2 (3.5.7)
2 2
Ad ⎛ Ad ⎞
F ⎜ 2 ⎟ 0 (3.5.10)
z 4 2 ⎝ z 8 ⎠
z
Table 3.5.2
D p2 Young’s moduli and Poisson’s ratios [17].
D p1 Material Young’s modulus Poisson’s
E (Gpa) ratio ( )
b 1 Fe 206 0.28
b 2 Cu 123 0.35
Al 68.5 0.34
Quartz glass 75.0 0.17
PMMA 2.33 0.34
Figure 3.5.1 Polystyrene 1.39 0.35
Nano-roughness on particle surfaces.
130