
Page 556 - Book Hosokawa Nanoparticle Technology Handbook
P. 556
APPLICATIONS 26 DISPERSION CONTROL OF Al O NANOPARTICLES IN ETHANOL
2 3
370 nm displayed the minimum viscosity at the suspensions were directory observed through FE-
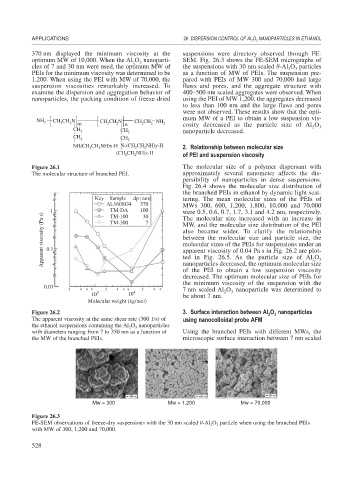
optimum MW of 10,000. When the Al O nanoparti- SEM. Fig. 26.3 shows the FE-SEM micrographs of
3
2
cles of 7 and 30 nm were used, the optimum MW of the suspensions with 30 nm scaled -Al O particles
3
2
PEIs for the minimum viscosity was determined to be as a function of MW of PEIs. The suspension pre-
1,200. When using the PEI with MW of 70,000, the pared with PEIs of MW 300 and 70,000 had large
suspension viscosities remarkably increased. To flaws and pores, and the aggregate structure with
examine the dispersion and aggregation behavior of 400–500 nm scaled aggregates were observed. When
nanoparticles, the packing condition of freeze-dried using the PEI of MW 1,200, the aggregates decreased
to less than 100 nm and the large flaws and pores
were not observed. These results show that the opti-
mum MW of a PEI to obtain a low suspension vis-
NH 2 CH CH N m CH CH N n CH CH NH 2 cosity decreased as the particle size of Al O
2
2
2
2
2
2
CH 2 CH 2 nanoparticle decreased. 2 3
CH
2 CH 2
NH(CH CH NH)x-H N-(CH CH NH)y-H 2. Relationship between molecular size
2
2
2
2
(CH CH NH)z-H of PEI and suspension viscosity
2
2
Figure 26.1 The molecular size of a polymer dispersant with
The molecular structure of branched PEI. approximately several nanometer affects the dis-
persibility of nanoparticles in dense suspensions.
Fig. 26.4 shows the molecular size distribution of
the branched PEIs in ethanol by dynamic light scat-
Key Sample dp [nm]
2 tering. The mean molecular sizes of the PEIs of
AL160SG4 370 MWs 300, 600, 1,200, 1,800, 10,000 and 70,000
TM-DA
1 8 6 TM-100 100 7 were 0.5, 0.6, 0.7, 1.7, 3.1 and 4.2 nm, respectively.
Apparent viscosity (Pa . s) 0.1 4 2 8 also became wider. To clarify the relationship
30
The molecular size increased with an increase in
TM-300
MW, and the molecular size distribution of the PEI
between the molecular size and particle size, the
molecular sizes of the PEIs for suspensions under an
apparent viscosity of 0.04 Pa s in Fig. 26.2 are plot-
ted in Fig. 26.5. As the particle size of Al O
6
2
nanoparticles decreased, the optimum molecular size
4
of the PEI to obtain a low suspension viscosity 3
2 decreased. The optimum molecular size of PEIs for
the minimum viscosity of the suspension with the
0.01
2 4 6 8 2 4 6 8 2 4 6 7 nm scaled Al O nanoparticle was determined to
2
3
10 3 10 4 be about 7 nm.
Molecular weight (kg/mol)
Figure 26.2 3. Surface interaction between Al O nanoparticles
2 3
The apparent viscosity at the same shear rate (300 1/s) of using nanocolloidal probe AFM
the ethanol suspensions containing the Al O nanoparticles
3
2
with diameters ranging from 7 to 350 nm as a function of Using the branched PEIs with different MWs, the
the MW of the branched PEIs. microscopic surface interaction between 7 nm scaled
Mw = 300 Mw = 1,200 Mw = 70,000
Figure 26.3
FE-SEM observations of freeze-dry suspensions with the 30 nm scaled -Al O particle when using the branched PEIs
2
3
with MW of 300, 1,200 and 70,000.
528