
Page 59 - Nanotechnology an introduction
P. 59
The main advantage of an interferometer is that the length can be arbitrarily extended to increase the sensitivity (provided the waveguide can be
made sufficiently uniform and the temperature maintained constant over the entire length). On the other hand it is usually only practical to measure
with one mode, and it is very difficult to measure absolute values of the effective refractive index. Moreover, in interferometry any lateral
inhomogeneity information is simply averaged. This is in contrast to grating coupling, in which energy is injected continuously under the cells in the
entire measuring zone, not just at the end of the waveguide. Therefore, the resonant peak shape carries information about the optical
microstructure of the cover medium [37], information inaccessible to an interferometric measurement.
5.5.4. Reverse Waveguides
In the conventional asymmetric waveguide, the support refractive index (e.g., optical glass) is greater than that of the cover, and this continues to
hold when the cover consists of an aqueous medium and living cells. The penetration depth into the cover is limited to a distance of around 200 nm,
implying that only a small part of the cell body is sensed by the evanescent field. The maximum probe depth is achieved at the cutoff point (N = n ),
S
when the sensitivity of such a waveguide is zero [81] and [162]; when the sensitivity is maximal the probe depth is even shorter, around 100 nm.
While this is completely sufficient for monitoring the spreading transition from sphere to segment (Figure 4.3), because the change in distribution of
polarizability overwhelmingly takes place in the immediate vicinity of the waveguide surface (and this is expected to hold even if the actual cell–
substratum contact is mediated by filopodia), the monitored optical signal will be insensitive to changes of polarizability distribution occurring within
the bulk of the cell body (which may arise through a reconfiguration of the cytoskeleton, or repositioning of the nucleus). If, however, n < n , the
S
C
penetration depth into the cover medium can be readily increased and tuned without any upper limit [80], [81] and [162] (note that the condition
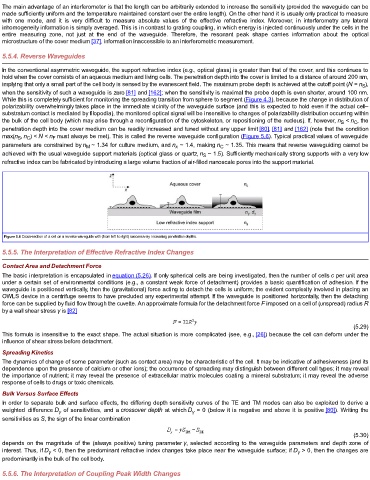
max(n , n ) < N < n must always be met). This is called the reverse waveguide configuration (Figure 5.6). Typical practical values of waveguide
C
F
S
parameters are constrained by n ~ 1.34 for culture medium, and n ~ 1.4, making n ~ 1.35. This means that reverse waveguiding cannot be
C
κ
M
achieved with the usual waveguide support materials (optical glass or quartz, n ~ 1.5). Sufficiently mechanically strong supports with a very low
S
refractive index can be fabricated by introducing a large volume fraction of air-filled nanoscale pores into the support material.
Figure 5.6 Cross-section of a cell on a reverse waveguide with (from left to right) successively increasing penetration depths.
5.5.5. The Interpretation of Effective Refractive Index Changes
Contact Area and Detachment Force
The basic interpretation is encapsulated in equation (5.26). If only spherical cells are being investigated, then the number of cells c per unit area
under a certain set of environmental conditions (e.g., a constant weak force of detachment) provides a basic quantification of adhesion. If the
waveguide is positioned vertically, then the (gravitational) force acting to detach the cells is uniform; the evident complexity involved in placing an
OWLS device in a centrifuge seems to have precluded any experimental attempt. If the waveguide is positioned horizontally, then the detaching
force can be supplied by fluid flow through the cuvette. An approximate formula for the detachment force F imposed on a cell of (unspread) radius R
by a wall shear stress γ is [82]
(5.29)
This formula is insensitive to the exact shape. The actual situation is more complicated (see, e.g., [26]) because the cell can deform under the
influence of shear stress before detachment.
Spreading Kinetics
The dynamics of change of some parameter (such as contact area) may be characteristic of the cell. It may be indicative of adhesiveness (and its
dependence upon the presence of calcium or other ions); the occurrence of spreading may distinguish between different cell types; it may reveal
the importance of nutrient; it may reveal the presence of extracellular matrix molecules coating a mineral substratum; it may reveal the adverse
response of cells to drugs or toxic chemicals.
Bulk Versus Surface Effects
In order to separate bulk and surface effects, the differing depth sensitivity curves of the TE and TM modes can also be exploited to derive a
weighted difference D of sensitivities, and a crossover depth at which D = 0 (below it is negative and above it is positive [80]). Writing the
γ
γ
sensitivities as S, the sign of the linear combination
(5.30)
depends on the magnitude of the (always positive) tuning parameter γ, selected according to the waveguide parameters and depth zone of
interest. Thus, if D < 0, then the predominant refractive index changes take place near the waveguide surface; if D > 0, then the changes are
γ
γ
predominantly in the bulk of the cell body.
5.5.6. The Interpretation of Coupling Peak Width Changes