
Page 211 - Neural Network Modeling and Identification of Dynamical Systems
P. 211
202 6. NEURAL NETWORK SEMIEMPIRICAL MODELING OF AIRCRAFT MOTION
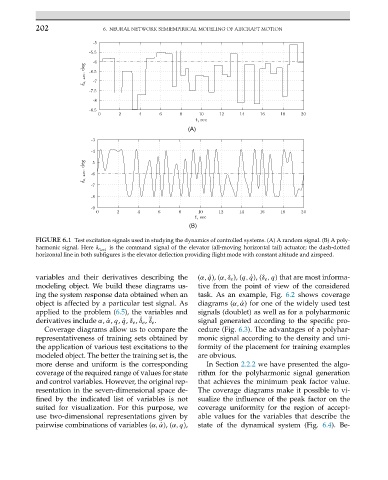
FIGURE 6.1 Test excitation signals used in studying the dynamics of controlled systems. (A) A random signal. (B) A poly-
is the command signal of the elevator (all-moving horizontal tail) actuator; the dash-dotted
harmonic signal. Here δ e act
horizontal line in both subfigures is the elevator deflection providing flight mode with constant altitude and airspeed.
variables and their derivatives describing the (α, ˙q), (α,δ e ), (q, ˙q), (δ e ,q) that are most informa-
modeling object. We build these diagrams us- tive from the point of view of the considered
ing the system response data obtained when an task. As an example, Fig. 6.2 shows coverage
object is affected by a particular test signal. As diagrams (α, ˙α) for one of the widely used test
applied to the problem (6.5), the variables and signals (doublet) as well as for a polyharmonic
˙ ¨
derivatives include α, ˙α, q, ˙q, δ e , δ e , δ e . signal generated according to the specific pro-
Coverage diagrams allow us to compare the cedure (Fig. 6.3). The advantages of a polyhar-
representativeness of training sets obtained by monic signal according to the density and uni-
the application of various test excitations to the formity of the placement for training examples
modeled object. The better the training set is, the are obvious.
more dense and uniform is the corresponding In Section 2.2.2 we have presented the algo-
coverage of the required range of values for state rithm for the polyharmonic signal generation
and control variables. However, the original rep- that achieves the minimum peak factor value.
resentation in the seven-dimensional space de- The coverage diagrams make it possible to vi-
fined by the indicated list of variables is not sualize the influence of the peak factor on the
suited for visualization. For this purpose, we coverage uniformity for the region of accept-
use two-dimensional representations given by able values for the variables that describe the
pairwise combinations of variables (α, ˙α), (α,q), state of the dynamical system (Fig. 6.4). Be-