
Page 326 - New Trends in Eco efficient and Recycled Concrete
P. 326
Comparative studies of the life cycle analysis between conventional and recycled aggregate concrete 283
Figure 10.5 Impact category indicators of NAC and RAC mixes (XC3 exposure class).
NAC, natural aggregate concrete; RAC, recycled aggregate concrete.
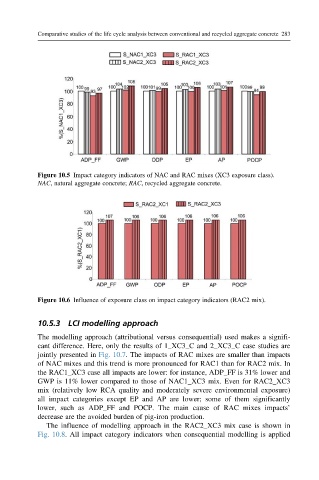
Figure 10.6 Influence of exposure class on impact category indicators (RAC2 mix).
10.5.3 LCI modelling approach
The modelling approach (attributional versus consequential) used makes a signifi-
cant difference. Here, only the results of 1_XC3_C and 2_XC3_C case studies are
jointly presented in Fig. 10.7. The impacts of RAC mixes are smaller than impacts
of NAC mixes and this trend is more pronounced for RAC1 than for RAC2 mix. In
the RAC1_XC3 case all impacts are lower: for instance, ADP_FF is 31% lower and
GWP is 11% lower compared to those of NAC1_XC3 mix. Even for RAC2_XC3
mix (relatively low RCA quality and moderately severe environmental exposure)
all impact categories except EP and AP are lower; some of them significantly
lower, such as ADP_FF and POCP. The main cause of RAC mixes impacts’
decrease are the avoided burden of pig-iron production.
The influence of modelling approach in the RAC2_XC3 mix case is shown in
Fig. 10.8. All impact category indicators when consequential modelling is applied