Page 366 - New Trends in Eco efficient and Recycled Concrete
P. 366

Equivalent functional unit in recycled aggregate concrete         321


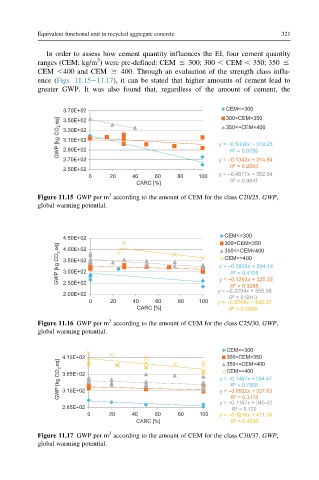
              In order to assess how cement quantity influences the EI, four cement quantity
                           3
           ranges (CEM; kg/m ) were pre-defined: CEM # 300; 300 , CEM , 350; 350 #
           CEM ,400 and CEM $ 400. Through an evaluation of the strength class influ-
           ence (Figs. 11.15 11.17), it can be stated that higher amounts of cement lead to
           greater GWP. It was also found that, regardless of the amount of cement, the

                  3.70E+02                                    CEM<=300
                                                              300<CEM<350
                 GWP [kg CO 2  eq]  3.30E+02                y = –0.5438x + 319.25
                  3.50E+02
                                                              350<=CEM<400
                  3.10E+02
                  2.90E+02
                                                               R² = 0.9295
                  2.70E+02                                  y = –0.1343x + 314.84
                                                               R² = 0.2583
                  2.50E+02
                                                            y = –0.4617x + 352.64
                         0     20    40    60    80    100
                                                               R² = 0.9647
                                      CARC [%]
                              3
           Figure 11.15 GWP per m according to the amount of CEM for the class C20/25. GWP,
           global warming potential.


                  4.50E+02                                    CEM<=300
                                                              300<CEM<350
                 GWP [kg CO 2  eq]  3.50E+02                y = –0.3802x + 294.14
                  4.00E+02
                                                              350<=CEM<400
                                                              CEM>=400
                  3.00E+02
                                                               R² = 0.4105
                                                            y = –0.1293x + 325.22
                  2.50E+02
                                                               R² = 0.3285
                                                            y = –0.3294x + 355.58
                  2.00E+02
                                                               R² = 0.5913
                         0     20    40    60    80    100  y = –0.5749x + 420.37
                                      CARC [%]                 R² = 0.5499
                              3
           Figure 11.16 GWP per m according to the amount of CEM for the class C25/30. GWP,
           global warming potential.
                                                              CEM<=300
                  4.15E+02                                    300<CEM<350
                 GWP [kg CO 2  eq]  3.65E+02                y = –0.1487x + 284.47
                                                              350<=CEM<400
                                                              CEM>=400
                                                               R² = 0.7968
                  3.15E+02
                                                            y = –0.0922x + 327.03
                                                               R² = 0.3179
                                                            y = –0.1147x + 345.42
                  2.65E+02
                                                                R² = 0.122
                         0    20     40    60    80    100  y = –0.3216x + 411.76
                                      CARC [%]                 R² = 0.4556
                              3
           Figure 11.17 GWP per m according to the amount of CEM for the class C30/37. GWP,
           global warming potential.
   361   362   363   364   365   366   367   368   369   370   371