
Page 532 - New Trends in Eco efficient and Recycled Concrete
P. 532
480 New Trends in Eco-efficient and Recycled Concrete
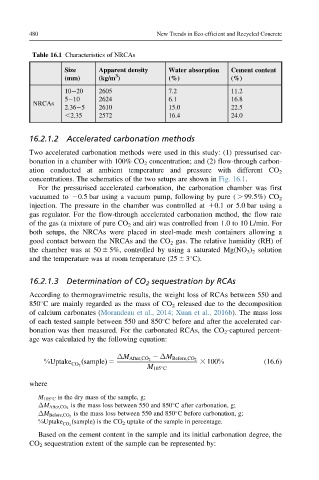
Table 16.1 Characteristics of NRCAs
Size Apparent density Water absorption Cement content
3
(mm) (kg/m ) (%) (%)
10 20 2605 7.2 11.2
5 10 2624 6.1 16.8
NRCAs
2.36 5 2610 15.0 22.5
,2.35 2572 16.4 24.0
16.2.1.2 Accelerated carbonation methods
Two accelerated carbonation methods were used in this study: (1) pressurised car-
bonation in a chamber with 100% CO 2 concentration; and (2) flow-through carbon-
ation conducted at ambient temperature and pressure with different CO 2
concentrations. The schematics of the two setups are shown in Fig. 16.1.
For the pressurised accelerated carbonation, the carbonation chamber was first
vacuumed to 20.5 bar using a vacuum pump, following by pure ( . 99.5%) CO 2
injection. The pressure in the chamber was controlled at 10.1 or 5.0 bar using a
gas regulator. For the flow-through accelerated carbonation method, the flow rate
of the gas (a mixture of pure CO 2 and air) was controlled from 1.0 to 10 L/min. For
both setups, the NRCAs were placed in steel-made mesh containers allowing a
good contact between the NRCAs and the CO 2 gas. The relative humidity (RH) of
the chamber was at 50 6 5%, controlled by using a saturated Mg(NO 3 ) 2 solution
and the temperature was at room temperature (25 6 3 C).
16.2.1.3 Determination of CO 2 sequestration by RCAs
According to thermogravimetric results, the weight loss of RCAs between 550 and
850 C are mainly regarded as the mass of CO 2 released due to the decomposition
of calcium carbonates (Morandeau et al., 2014; Xuan et al., 2016b). The mass loss
of each tested sample between 550 and 850 C before and after the accelerated car-
bonation was then measured. For the carbonated RCAs, the CO 2 -captured percent-
age was calculated by the following equation:
%Uptake ðsampleÞ 5 ΔM After;CO 2 2 ΔM Before;CO 2 3 100% (16.6)
CO 2
M 105 C
where
M 105 C is the dry mass of the sample, g;
is the mass loss between 550 and 850 C after carbonation, g;
ΔM After;CO 2
is the mass loss between 550 and 850 C before carbonation, g;
ΔM Before;CO 2
%Uptake ðsampleÞ is the CO 2 uptake of the sample in percentage.
CO 2
Based on the cement content in the sample and its initial carbonation degree, the
CO 2 sequestration extent of the sample can be represented by: