
Page 534 - New Trends in Eco efficient and Recycled Concrete
P. 534
482 New Trends in Eco-efficient and Recycled Concrete
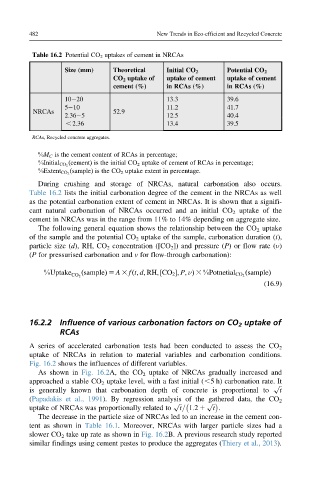
Table 16.2 Potential CO 2 uptakes of cement in NRCAs
Size (mm) Theoretical Initial CO 2 Potential CO 2
CO 2 uptake of uptake of cement uptake of cement
cement (%) in RCAs (%) in RCAs (%)
10 20 13.3 39.6
5 10 11.2 41.7
NRCAs 52.9
2.36 5 12.5 40.4
, 2.36 13.4 39.5
RCAs, Recycled concrete aggregates.
%M C is the cement content of RCAs in percentage;
ðcementÞ is the initial CO 2 uptake of cement of RCAs in percentage;
%Initial CO 2
ðsampleÞ is the CO 2 uptake extent in percentage.
%Extent CO 2
During crushing and storage of NRCAs, natural carbonation also occurs.
Table 16.2 lists the initial carbonation degree of the cement in the NRCAs as well
as the potential carbonation extent of cement in NRCAs. It is shown that a signifi-
cant natural carbonation of NRCAs occurred and an initial CO 2 uptake of the
cement in NRCAs was in the range from 11% to 14% depending on aggregate size.
The following general equation shows the relationship between the CO 2 uptake
of the sample and the potential CO 2 uptake of the sample, carbonation duration (t),
particle size (d), RH, CO 2 concentration ([CO 2 ]) and pressure (P) or flow rate (ν)
(P for pressurised carbonation and v for flow-through carbonation):
%Uptake ðsampleÞ 5 A 3 fðt; d; RH; ½CO 2 ; P; νÞ 3 %Potnetial CO 2 ðsampleÞ
CO 2
(16.9)
16.2.2 Influence of various carbonation factors on CO 2 uptake of
RCAs
A series of accelerated carbonation tests had been conducted to assess the CO 2
uptake of NRCAs in relation to material variables and carbonation conditions.
Fig. 16.2 shows the influences of different variables.
As shown in Fig. 16.2A, the CO 2 uptake of NRCAs gradually increased and
approached a stable CO 2 uptake level, with a fast initial (,5 h) carbonation rate. It
p ffiffi
is generally known that carbonation depth of concrete is proportional to t
(Papadakis et al., 1991). By regression analysis of the gathered data, the CO 2
p ffiffi p ffiffi
uptake of NRCAs was proportionally related to t= 1:2 1 t .
The decrease in the particle size of NRCAs led to an increase in the cement con-
tent as shown in Table 16.1. Moreover, NRCAs with larger particle sizes had a
slower CO 2 take up rate as shown in Fig. 16.2B. A previous research study reported
similar findings using cement pastes to produce the aggregates (Thiery et al., 2013).