Page 89 - New Trends in Eco efficient and Recycled Concrete
P. 89

Recycled plastic                                                   63


           segregation problem in PA concrete mixes (Haghi et al., 2006; Tang et al., 2008;
           Xu et al., 2012).
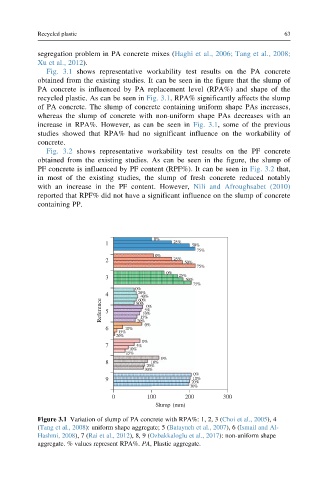
              Fig. 3.1 shows representative workability test results on the PA concrete
           obtained from the existing studies. It can be seen in the figure that the slump of
           PA concrete is influenced by PA replacement level (RPA%) and shape of the
           recycled plastic. As can be seen in Fig. 3.1, RPA% significantly affects the slump
           of PA concrete. The slump of concrete containing uniform shape PAs increases,
           whereas the slump of concrete with non-uniform shape PAs decreases with an
           increase in RPA%. However, as can be seen in Fig. 3.1, some of the previous
           studies showed that RPA% had no significant influence on the workability of
           concrete.
              Fig. 3.2 shows representative workability test results on the PF concrete
           obtained from the existing studies. As can be seen in the figure, the slump of
           PF concrete is influenced by PF content (RPF%). It can be seen in Fig. 3.2 that,
           in most of the existing studies, the slump of fresh concrete reduced notably
           with an increase in the PF content. However, Nili and Afroughsabet (2010)
           reported that RPF% did not have a significant influence on the slump of concrete
           containing PP.


                                           0%
                              1                 25%  50%
                                                      75%
                                           0%
                              2                 25%  50%
                                                      75%
                                              0%
                              3                  25% 50%
                                                     75%
                                      0%
                              4       20%
                                       40%
                                      60%
                            Reference  5  80% 10%
                                         0%
                                        5%
                                       15%
                                      20%
                                        0%
                              6    10%
                                 15%
                                20%
                                       0%
                              7       5%
                                    10%
                                   15%
                                             0%
                              8           10%
                                         20%
                                        30%
                                                     0%
                              9                      10%
                                                     20%
                                                    30%
                               0         100       200       300
                                           Slump (mm)
           Figure 3.1 Variation of slump of PA concrete with RPA%: 1, 2, 3 (Choi et al., 2005), 4
           (Tang et al., 2008): uniform shape aggregate; 5 (Batayneh et al., 2007), 6 (Ismail and Al-
           Hashmi, 2008), 7 (Rai et al., 2012), 8, 9 (Ozbakkaloglu et al., 2017): non-uniform shape
           aggregate. % values represent RPA%. PA, Plastic aggregate.
   84   85   86   87   88   89   90   91   92   93   94