
Page 94 - New Trends in Eco efficient and Recycled Concrete
P. 94
68 New Trends in Eco-efficient and Recycled Concrete
0%
1 0.28%
0.55%
1%
0.1%
2 0.3%
0.5%
0.1%
0.47%
3 0.7%
1.4% 0.93% 0%
0.2%
4 0.1%
0.3%
0%
5 0.2% 0.3%
0.4% 0%
Reference 6 7 0% 0.5% 1% 0.2%
0.05%
0.1%
1.5%
0%
8 0.67%
0%
0.5%
9 1%
1.5%
0%
10 0.5%
1%
0% 1.5%
0.5%
11 0.75%
1% 0%
0.05%
12 0.18%
0.3%
0 20 40 60 80
Compressive strength (MPa)
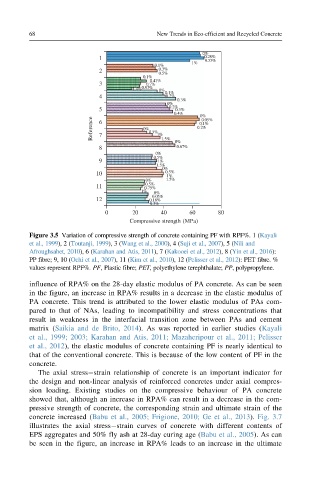
Figure 3.5 Variation of compressive strength of concrete containing PF with RPF%. 1 (Kayali
et al., 1999), 2 (Toutanji, 1999), 3 (Wang et al., 2000), 4 (Suji et al., 2007), 5 (Nili and
Afroughsabet, 2010), 6 (Karahan and Atis, 2011), 7 (Kakooei et al., 2012), 8 (Yin et al., 2016):
PP fibre; 9, 10 (Ochi et al., 2007), 11 (Kim et al., 2010), 12 (Pelisser et al., 2012): PET fibre. %
values represent RPF%. PF, Plastic fibre; PET, polyethylene terephthalate; PP, polypropylene.
influence of RPA% on the 28-day elastic modulus of PA concrete. As can be seen
in the figure, an increase in RPA% results in a decrease in the elastic modulus of
PA concrete. This trend is attributed to the lower elastic modulus of PAs com-
pared to that of NAs, leading to incompatibility and stress concentrations that
result in weakness in the interfacial transition zone between PAs and cement
matrix (Saikia and de Brito, 2014). As was reported in earlier studies (Kayali
et al., 1999; 2003; Karahan and Atis, 2011; Mazaheripour et al., 2011; Pelisser
et al., 2012), the elastic modulus of concrete containing PF is nearly identical to
that of the conventional concrete. This is because of the low content of PF in the
concrete.
The axial stress strain relationship of concrete is an important indicator for
the design and non-linear analysis of reinforced concretes under axial compres-
sion loading. Existing studies on the compressive behaviour of PA concrete
showed that, although an increase in RPA% can result in a decrease in the com-
pressive strength of concrete, the corresponding strain and ultimate strain of the
concrete increased (Babu et al., 2005; Frigione, 2010; Ge et al., 2013). Fig. 3.7
illustrates the axial stress strain curves of concrete with different contents of
EPS aggregates and 50% fly ash at 28-day curing age (Babu et al., 2005). As can
be seen in the figure, an increase in RPA% leads to an increase in the ultimate