
Page 93 - New Trends in Eco efficient and Recycled Concrete
P. 93
0%
10%
1 20%
30%
0%
20%
2 60% 40%
80%
0%
30%
3 70% 50%
0%
30%
4 50%
70%
0%
Reference 6 50% 0%
50%
5
0%
50%
7
0%
20%
8 60% 40%
100% 80% 0%
10%
9 20%
30%
0%
10%
10 20%
30%
0 20 40 60 80 100
(A) Compressive strength (MPa)
0%
25%
1 50%
75%
0%
25%
2 50%
75%
0%
3 50% 25%
75%
0%
5%
4 10%
20% 15% 0%
10%
30%
5 100% 70% 50%
Reference 6 100% 70% 0% 30% 0%
10%
50%
7 50% 25%
75%
0%
5%
8 15%
45% 30%
0%
9 20% 10%
50%
0%
60%
10 100%
0%
10%
15%
11 20%
30%
0 20 40 60
(B) Compressive strength (MPa)
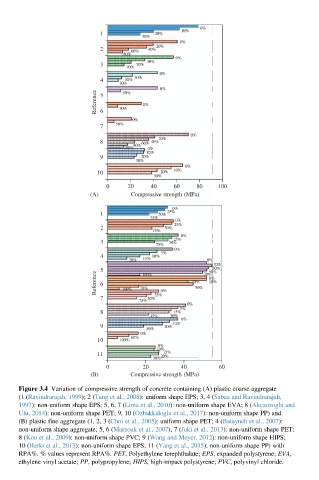
Figure 3.4 Variation of compressive strength of concrete containing (A) plastic coarse aggregate
(1 (Ravindrarajah, 1999); 2 (Tang et al., 2008): uniform shape EPS; 3, 4 (Sabaa and Ravindrarajah,
1997): non-uniform shape EPS; 5, 6, 7 (Lima et al., 2010): non-uniform shape EVA; 8 (Akcaozoglu and
Ulu, 2014): non-uniform shape PET; 9, 10 (Ozbakkaloglu et al., 2017): non-uniform shape PP) and
(B) plastic fine aggregate (1, 2, 3 (Choi et al., 2005): uniform shape PET; 4 (Batayneh et al., 2007):
non-uniform shape aggregate; 5, 6 (Marzouk et al., 2007), 7 (Juki et al., 2013): non-uniform shape PET;
8(Kou et al., 2009): non-uniform shape PVC; 9 (Wang and Meyer, 2012): non-uniform shape HIPS;
10 (Herki et al., 2013): non-uniform shape EPS; 11 (Yang et al., 2015): non-uniform shape PP) with
RPA%. % values represent RPA%. PET, Polyethylene terephthalate; EPS, expanded polystyrene; EVA,
ethylene-vinyl acetate; PP, polypropylene; HIPS, high-impact polystyrene; PVC, polyvinyl chloride.