
Page 95 - New Trends in Eco efficient and Recycled Concrete
P. 95
Recycled plastic 69
0%
1 25%
75% 50%
0%
2 50% 25%
75%
0%
3 25%
75% 50%
0%
4 40% 20%
80% 60%
0%
5 20% 10%
0%
6 10%
50% 30% 20% 10%
0%
Reference 7 8 50% 30% 20% 10%
20%
0%
9 50% 30% 25% 0%
50%
70%
0%
10 5%
45% 30% 15%
0%
11 50% 30%
70%
0%
12 50% 30%
70%
0%
13 20% 10%
30%
0%
14 20% 10%
30%
0 10 20 30 40
Elastic modulus (GPa)
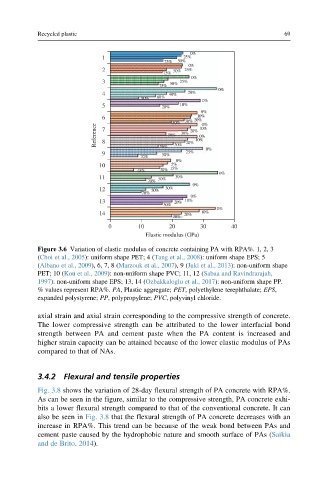
Figure 3.6 Variation of elastic modulus of concrete containing PA with RPA%. 1, 2, 3
(Choi et al., 2005): uniform shape PET; 4 (Tang et al., 2008): uniform shape EPS; 5
(Albano et al., 2009), 6, 7, 8 (Marzouk et al., 2007), 9 (Juki et al., 2013): non-uniform shape
PET; 10 (Kou et al., 2009): non-uniform shape PVC; 11, 12 (Sabaa and Ravindrarajah,
1997): non-uniform shape EPS; 13, 14 (Ozbakkaloglu et al., 2017): non-uniform shape PP.
% values represent RPA%. PA, Plastic aggregate; PET, polyethylene terephthalate; EPS,
expanded polystyrene; PP, polypropylene; PVC, polyvinyl chloride.
axial strain and axial strain corresponding to the compressive strength of concrete.
The lower compressive strength can be attributed to the lower interfacial bond
strength between PA and cement paste when the PA content is increased and
higher strain capacity can be attained because of the lower elastic modulus of PAs
compared to that of NAs.
3.4.2 Flexural and tensile properties
Fig. 3.8 shows the variation of 28-day flexural strength of PA concrete with RPA%.
As can be seen in the figure, similar to the compressive strength, PA concrete exhi-
bits a lower flexural strength compared to that of the conventional concrete. It can
also be seen in Fig. 3.8 that the flexural strength of PA concrete decreases with an
increase in RPA%. This trend can be because of the weak bond between PAs and
cement paste caused by the hydrophobic nature and smooth surface of PAs (Saikia
and de Brito, 2014).