Page 96 - New Trends in Eco efficient and Recycled Concrete
P. 96

70                                New Trends in Eco-efficient and Recycled Concrete


                            15
                                                       0% EPS
                                                       30% EPS
                          Axial stress (MPa)  10 5     80% EPS
                                                       50% EPS
                                                       64% EPS
                                                       90% EPS


                            0
                              0    0.2   0.4    0.6   0.8   1
                                        Axial strain (%)

         Figure 3.7 Axial stress strain relationship of EPS aggregate concrete containing 50% fly
         ash (Babu et al., 2005). EPS, Expanded polystyrene.


                                                         0%
                                                         10%
                          1                             30%
                                                 70%  55%
                                        100%
                                                         0%
                                                      10%
                          2                         30%
                                  100%    70%       50%
                                                         0%
                                                     10%
                          3                   50%  30%
                                  100%  70%
                                                 0%
                                              10%
                          4                 15%
                                           20%
                         Reference  5  70%  50%  25%
                                             0%
                                           5% 0%
                          6            15%  10%
                                    20%
                                              0%
                                            5%
                          7              10%
                                       15%
                                               0%
                                               10%
                          8                  20%
                                         30%
                                                     0%
                                                    10%
                          9                  30%  20%
                            0     2      4      6      8     10
                                     Flexural strength (MPa)
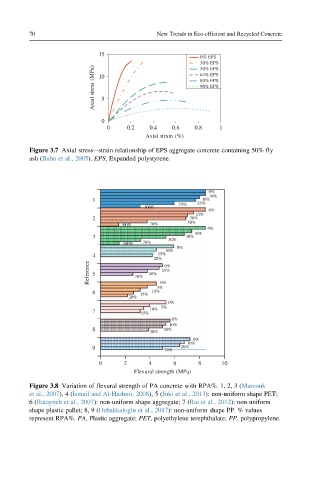
         Figure 3.8 Variation of flexural strength of PA concrete with RPA%. 1, 2, 3 (Marzouk
         et al., 2007), 4 (Ismail and Al-Hashmi, 2008), 5 (Juki et al., 2013): non-uniform shape PET;
         6(Batayneh et al., 2007): non-uniform shape aggregate; 7 (Rai et al., 2012): non-uniform
         shape plastic pallet; 8, 9 (Ozbakkaloglu et al., 2017): non-uniform shape PP. % values
         represent RPA%. PA, Plastic aggregate; PET, polyethylene terephthalate; PP, polypropylene.
   91   92   93   94   95   96   97   98   99   100   101