
Page 174 - Numerical Analysis and Modelling in Geomechanics
P. 174
MODELLING OF GROUND WAVES 155
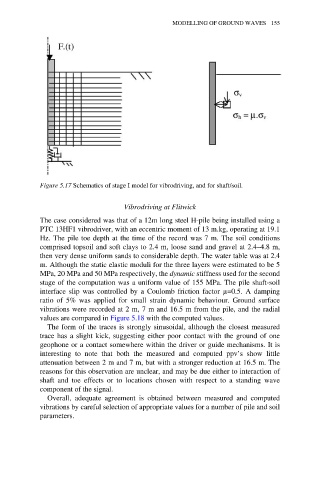
Figure 5.17 Schematics of stage I model for vibrodriving, and for shaft/soil.
Vibrodriving at Flitwick
The case considered was that of a 12m long steel H-pile being installed using a
PTC 13HF1 vibrodriver, with an eccentric moment of 13 m.kg, operating at 19.1
Hz. The pile toe depth at the time of the record was 7 m. The soil conditions
comprised topsoil and soft clays to 2.4 m, loose sand and gravel at 2.4–4.8 m,
then very dense uniform sands to considerable depth. The water table was at 2.4
m. Although the static elastic moduli for the three layers were estimated to be 5
MPa, 20 MPa and 50 MPa respectively, the dynamic stiffness used for the second
stage of the computation was a uniform value of 155 MPa. The pile shaft-soil
interface slip was controlled by a Coulomb friction factor µ=0.5. A damping
ratio of 5% was applied for small strain dynamic behaviour. Ground surface
vibrations were recorded at 2 m, 7 m and 16.5 m from the pile, and the radial
values are compared in Figure 5.18 with the computed values.
The form of the traces is strongly sinusoidal, although the closest measured
trace has a slight kick, suggesting either poor contact with the ground of one
geophone or a contact somewhere within the driver or guide mechanisms. It is
interesting to note that both the measured and computed ppv’s show little
attenuation between 2 m and 7 m, but with a stronger reduction at 16.5 m. The
reasons for this observation are unclear, and may be due either to interaction of
shaft and toe effects or to locations chosen with respect to a standing wave
component of the signal.
Overall, adequate agreement is obtained between measured and computed
vibrations by careful selection of appropriate values for a number of pile and soil
parameters.