
Page 327 - Numerical Analysis and Modelling in Geomechanics
P. 327
308 ANALYSIS AND DESIGN OF PILE GROUPS
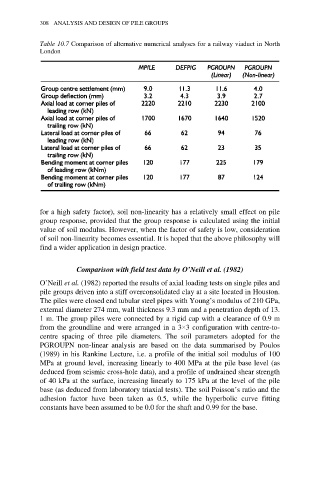
Table 10.7 Comparison of alternative numerical analyses for a railway viaduct in North
London
for a high safety factor), soil non-linearity has a relatively small effect on pile
group response, provided that the group response is calculated using the initial
value of soil modulus. However, when the factor of safety is low, consideration
of soil non-linearity becomes essential. It is hoped that the above philosophy will
find a wider application in design practice.
Comparison with field test data by O’Neill et al. (1982)
O’Neill et al. (1982) reported the results of axial loading tests on single piles and
pile groups driven into a stiff overconsolidated clay at a site located in Houston.
The piles were closed end tubular steel pipes with Young’s modulus of 210 GPa,
external diameter 274 mm, wall thickness 9.3 mm and a penetration depth of 13.
1 m. The group piles were connected by a rigid cap with a clearance of 0.9 m
from the groundline and were arranged in a 3×3 configuration with centre-to-
centre spacing of three pile diameters. The soil parameters adopted for the
PGROUPN non-linear analysis are based on the data summarised by Poulos
(1989) in his Rankine Lecture, i.e. a profile of the initial soil modulus of 100
MPa at ground level, increasing linearly to 400 MPa at the pile base level (as
deduced from seismic cross-hole data), and a profile of undrained shear strength
of 40 kPa at the surface, increasing linearly to 175 kPa at the level of the pile
base (as deduced from laboratory triaxial tests). The soil Poisson’s ratio and the
adhesion factor have been taken as 0.5, while the hyperbolic curve fitting
constants have been assumed to be 0.0 for the shaft and 0.99 for the base.