
Page 328 - Numerical Analysis and Modelling in Geomechanics
P. 328
F.BASILE 309
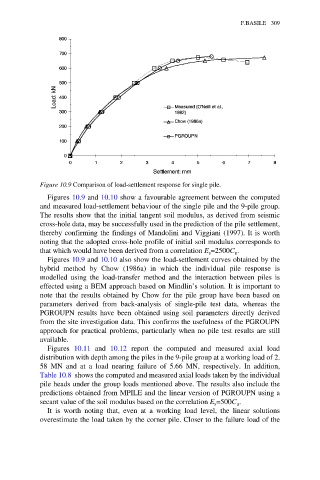
Figure 10.9 Comparison of load-settlement response for single pile.
Figures 10.9 and 10.10 show a favourable agreement between the computed
and measured load-settlement behaviour of the single pile and the 9-pile group.
The results show that the initial tangent soil modulus, as derived from seismic
cross-hole data, may be successfully used in the prediction of the pile settlement,
thereby confirming the findings of Mandolini and Viggiani (1997). It is worth
noting that the adopted cross-hole profile of initial soil modulus corresponds to
that which would have been derived from a correlation E =2500C .
s
u
Figures 10.9 and 10.10 also show the load-settlement curves obtained by the
hybrid method by Chow (1986a) in which the individual pile response is
modelled using the load-transfer method and the interaction between piles is
effected using a BEM approach based on Mindlin’s solution. It is important to
note that the results obtained by Chow for the pile group have been based on
parameters derived from back-analysis of single-pile test data, whereas the
PGROUPN results have been obtained using soil parameters directly derived
from the site investigation data. This confirms the usefulness of the PGROUPN
approach for practical problems, particularly when no pile test results are still
available.
Figures 10.11 and 10.12 report the computed and measured axial load
distribution with depth among the piles in the 9-pile group at a working load of 2.
58 MN and at a load nearing failure of 5.66 MN, respectively. In addition,
Table 10.8 shows the computed and measured axial loads taken by the individual
pile heads under the group loads mentioned above. The results also include the
predictions obtained from MPILE and the linear version of PGROUPN using a
secant value of the soil modulus based on the correlation E =500C .
s
u
It is worth noting that, even at a working load level, the linear solutions
overestimate the load taken by the corner pile. Closer to the failure load of the