
Page 329 - Numerical Analysis and Modelling in Geomechanics
P. 329
310 ANALYSIS AND DESIGN OF PILE GROUPS
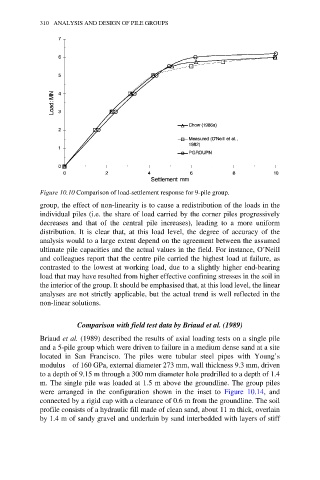
Figure 10.10 Comparison of load-settlement response for 9-pile group.
group, the effect of non-linearity is to cause a redistribution of the loads in the
individual piles (i.e. the share of load carried by the corner piles progressively
decreases and that of the central pile increases), leading to a more uniform
distribution. It is clear that, at this load level, the degree of accuracy of the
analysis would to a large extent depend on the agreement between the assumed
ultimate pile capacities and the actual values in the field. For instance, O’Neill
and colleagues report that the centre pile carried the highest load at failure, as
contrasted to the lowest at working load, due to a slightly higher end-bearing
load that may have resulted from higher effective confining stresses in the soil in
the interior of the group. It should be emphasised that, at this load level, the linear
analyses are not strictly applicable, but the actual trend is well reflected in the
non-linear solutions.
Comparison with field test data by Briaud et al. (1989)
Briaud et al. (1989) described the results of axial loading tests on a single pile
and a 5-pile group which were driven to failure in a medium dense sand at a site
located in San Francisco. The piles were tubular steel pipes with Young’s
modulus of 160 GPa, external diameter 273 mm, wall thickness 9.3 mm, driven
to a depth of 9.15 m through a 300 mm diameter hole predrilled to a depth of 1.4
m. The single pile was loaded at 1.5 m above the groundline. The group piles
were arranged in the configuration shown in the inset to Figure 10.14, and
connected by a rigid cap with a clearance of 0.6 m from the groundline. The soil
profile consists of a hydraulic fill made of clean sand, about 11 m thick, overlain
by 1.4 m of sandy gravel and underlain by sand interbedded with layers of stiff