
Page 332 - Numerical Analysis and Modelling in Geomechanics
P. 332
F.BASILE 313
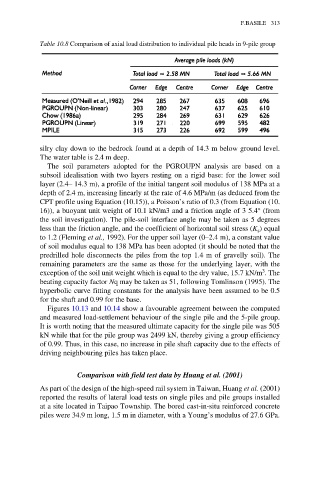
Table 10.8 Comparison of axial load distribution to individual pile heads in 9-pile group
silry clay down to the bedrock found at a depth of 14.3 m below ground level.
The water table is 2.4 m deep.
The soil parameters adopted for the PGROUPN analysis are based on a
subsoil idealisation with two layers resting on a rigid base: for the lower soil
layer (2.4– 14.3 m), a profile of the initial tangent soil modulus of 138 MPa at a
depth of 2.4 m, increasing linearly at the rate of 4.6 MPa/m (as deduced from the
CPT profile using Equation (10.15)), a Poisson’s ratio of 0.3 (from Equation (10.
16)), a buoyant unit weight of 10.1 kN/m3 and a friction angle of 3 5.4° (from
the soil investigation). The pile-soil interface angle may be taken as 5 degrees
less than the friction angle, and the coefficient of horizontal soil stress (K ) equal
s
to 1.2 (Fleming et al., 1992). For the upper soil layer (0–2.4 m), a constant value
of soil modulus equal to 138 MPa has been adopted (it should be noted that the
predrilled hole disconnects the piles from the top 1.4 m of gravelly soil). The
remaining parameters are the same as those for the underlying layer, with the
3
exception of the soil unit weight which is equal to the dry value, 15.7 kN/m . The
beating capacity factor Nq may be taken as 51, following Tomlinson (1995). The
hyperbolic curve fitting constants for the analysis have been assumed to be 0.5
for the shaft and 0.99 for the base.
Figures 10.13 and 10.14 show a favourable agreement between the computed
and measured load-settlement behaviour of the single pile and the 5-pile group.
It is worth noting that the measured ultimate capacity for the single pile was 505
kN while that for the pile group was 2499 kN, thereby giving a group efficiency
of 0.99. Thus, in this case, no increase in pile shaft capacity due to the effects of
driving neighbouring piles has taken place.
Comparison with field test data by Huang et al. (2001)
As part of the design of the high-speed rail system in Taiwan, Huang et al. (2001)
reported the results of lateral load tests on single piles and pile groups installed
at a site located in Taipao Township. The bored cast-in-situ reinforced concrete
piles were 34.9 m long, 1.5 m in diameter, with a Young’s modulus of 27.6 GPa.