
Page 36 - Numerical Analysis and Modelling in Geomechanics
P. 36
SURFACE DISPLACEMENTS OF AN AIRFIELD RUNWAY 17
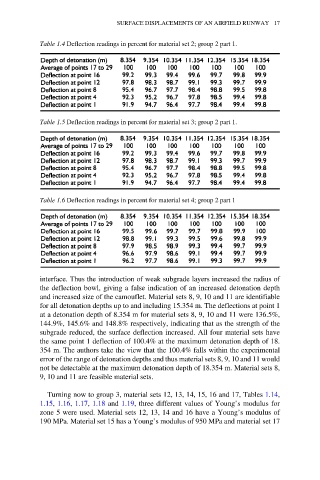
Table 1.4 Deflection readings in percent for material set 2; group 2 part 1.
Table 1.5 Deflection readings in percent for material set 3; group 2 part 1.
Table 1.6 Deflection readings in percent for material set 4; group 2 part 1
interface. Thus the introduction of weak subgrade layers increased the radius of
the deflection bowl, giving a false indication of an increased detonation depth
and increased size of the camouflet. Material sets 8, 9, 10 and 11 are identifiable
for all detonation depths up to and including 15.354 m. The deflections at point 1
at a detonation depth of 8.354 m for material sets 8, 9, 10 and 11 were 136.5%,
144.9%, 145.6% and 148.8% respectively, indicating that as the strength of the
subgrade reduced, the surface deflection increased. All four material sets have
the same point 1 deflection of 100.4% at the maximum detonation depth of 18.
354 m. The authors take the view that the 100.4% falls within the experimental
error of the range of detonation depths and thus material sets 8, 9, 10 and 11 would
not be detectable at the maximum detonation depth of 18.354 m. Material sets 8,
9, 10 and 11 are feasible material sets.
Turning now to group 3, material sets 12, 13, 14, 15, 16 and 17, Tables 1.14,
1.15, 1.16, 1.17, 1.18 and 1.19, three different values of Young’s modulus for
zone 5 were used. Material sets 12, 13, 14 and 16 have a Young’s modulus of
190 MPa. Material set 15 has a Young’s modulus of 950 MPa and material set 17