
Page 55 - Numerical Analysis and Modelling in Geomechanics
P. 55
36 A.A.JAVADI
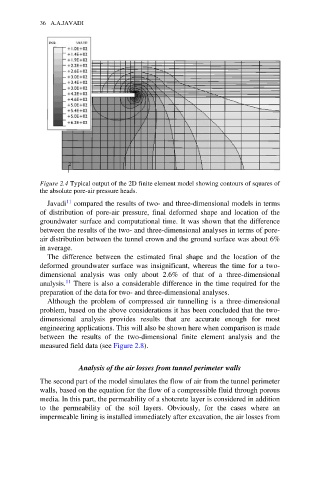
Figure 2.4 Typical output of the 2D finite element model showing contours of squares of
the absolute pore-air pressure heads.
11
Javadi compared the results of two- and three-dimensional models in terms
of distribution of pore-air pressure, final deformed shape and location of the
groundwater surface and computational time. It was shown that the difference
between the results of the two- and three-dimensional analyses in terms of pore-
air distribution between the tunnel crown and the ground surface was about 6%
in average.
The difference between the estimated final shape and the location of the
deformed groundwater surface was insignificant, whereas the time for a two-
dimensional analysis was only about 2.6% of that of a three-dimensional
analysis. 11 There is also a considerable difference in the time required for the
preparation of the data for two- and three-dimensional analyses.
Although the problem of compressed air tunnelling is a three-dimensional
problem, based on the above considerations it has been concluded that the two-
dimensional analysis provides results that are accurate enough for most
engineering applications. This will also be shown here when comparison is made
between the results of the two-dimensional finite element analysis and the
measured field data (see Figure 2.8).
Analysis of the air losses from tunnel perimeter walls
The second part of the model simulates the flow of air from the tunnel perimeter
walls, based on the equation for the flow of a compressible fluid through porous
media. In this part, the permeability of a shotcrete layer is considered in addition
to the permeability of the soil layers. Obviously, for the cases where an
impermeable lining is installed immediately after excavation, the air losses from