Page 471 - Numerical Methods for Chemical Engineering
P. 471
460     9 Fourier analysis


                   Let the Fourier transforms of x(t) and F(t)be X(ω) and F(ω) respectively. Relate the two
                   through a convolution, X(ω) = R(ω)F(ω). At what frequency ω c does R(ω) become very
                   large, exhibiting resonance? What effect does ζ have on the resonance phenomenon? Hint:
                   Relate first the Fourier transforms of derivatives of x(t) to that of x(t) itself.
                                                  κ
                   9.B.2. For m = 1, K = 1, and ζ = 10 ,κ = 2, 1, 0, −1, −2, −3, plot the response x(t)
                                                 κ
                   to F(t) = cos(ωt) for ω/ω c = 1 ± 10 ,κ =−1, −2, −3.
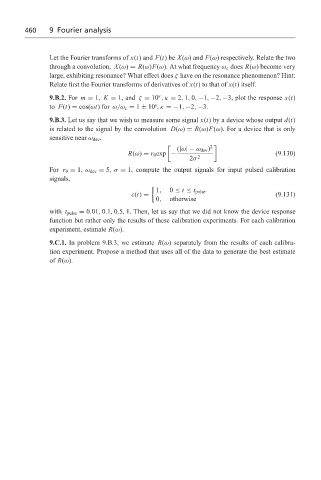
                   9.B.3. Let us say that we wish to measure some signal x(t) by a device whose output d(t)
                   is related to the signal by the convolution D(ω) = R(ω)F(ω). For a device that is only
                   sensitive near ω dev ,
                                                                 2
                                                        (|ω| − ω dev )
                                          R(ω) = r 0 exp −                           (9.130)
                                                           2σ 2
                   For r 0 = 1,ω dev = 5,σ = 1, compute the output signals for input pulsed calibration
                   signals,

                                                  1,  0 ≤ t ≤ t pulse
                                           c(t) =                                    (9.131)
                                                  0,  otherwise
                   with t pulse = 0.01, 0.1, 0.5, 1. Then, let us say that we did not know the device response
                   function but rather only the results of these calibration experiments. For each calibration
                   experiment, estimate R(ω).

                   9.C.1. In problem 9.B.3, we estimate R(ω) separately from the results of each calibra-
                   tion experiment. Propose a method that uses all of the data to generate the best estimate
                   of R(ω).

