
Page 231 - Op Amps Design, Applications, and Troubleshooting
P. 231
Fitter Fundamentals 213
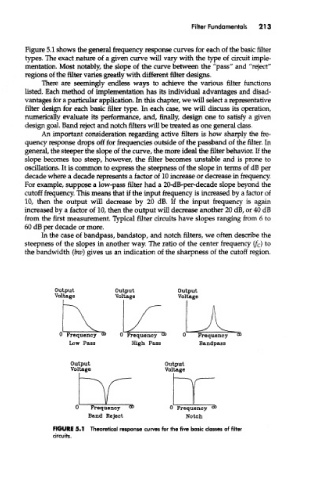
Figure 51 shows the general frequency response curves for each of the basic filter
types. The exact nature of a given curve will vary with the type of circuit imple-
mentation. Most notably, the slope of the curve between the "pass" and "reject"
regions of the filter varies greatly with different filter designs.
There are seemingly endless ways to achieve the various filter functions
listed. Each method of implementation has its individual advantages and disad-
vantages for a particular application. In this chapter, we will select a representative
filter design for each basic filter type. In each case, we will discuss its operation,
numerically evaluate its performance, and, finally, design one to satisfy a given
design goal. Band reject and notch filters will be treated as one general class.
An important consideration regarding active filters is how sharply the fre-
quency response drops off for frequencies outside of the passband of the filter. In
general, the steeper the slope of the curve, the more ideal the filter behavior. If the
slope becomes too steep, however, the filter becomes unstable and is prone to
oscillations. It is common to express the steepness of the slope in terms of dB per
decade where a decade represents a factor of 10 increase or decrease in frequency.
For example, suppose a low-pass filter had a 20-dB-per-decade slope beyond the
cutoff frequency. This means that if the input frequency is increased by a factor of
10, then the output wiH decrease by 20 dB. If the input frequency is again
increased by a factor of 10, then the output will decrease another 20 dB, or 40 dB
from the first measurement. Typical filter circuits have slopes ranging from 6 to
60 dB per decade or more.
In the case of bandpass, bandstop, and notch filters, we often describe the
steepness of the slopes in another way. The ratio of the center frequency (f c) to
the bandwidth (bzv) gives us an indication of the sharpness of the cutoff region.
FIGURE 5.1 Theoretical response curves for the five basic classes of filter
circuits.