
Page 132 - Open-Hole Log Analysis and Formation Evaluation
P. 132
k
k=
k=
k=
=
k=
k=
DST
where
4
be
(79
fall
(250
0.105
0.136
X
X
X
buildup
X
X
X
are:
into
results.
@
¢
expected
measurement
two
6
X
6%
X
in
drawdown
X
X&
that
and
[140/h@,
[122/b(py
the
-
and
-
8
Sy)
Disparate
5,7?
S,;')?
$,,?
different
wellbore
X
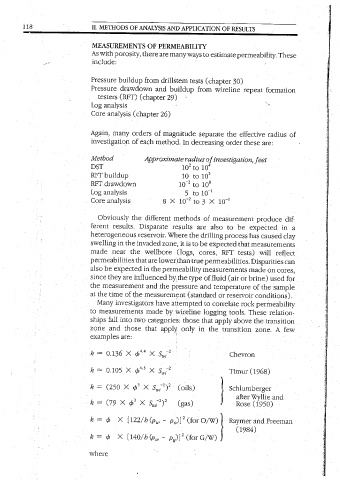
: examples those zone and ships made by to measurements Many investigators have measurement at the time of the the the by,the since they are influenced also lower than permeabilities that are the made near zone, swelling in the invaded reservoir. Where heterogeneous results ferent the Obviously analysis Core 5 Log analysis 107 drawdown RFT 10 RFT
apply
method.
categories:
pg)]*
it
p,)]*
drillstem
In
10°
is
(gas)
(logs,
only
Coils)
‘ These ways to estimate permeability. OF RESULTS AND APPLICATION
pressure
(for
to
(for
to
the
those
to
to
methods
wireline
permeability
type
attempted
tests
in
to3
are
be
of
to
10°
10
from
10°
and
tolo!
that
X
(standard
cores,
GW)
the
also
decreasing
separate
or
OAW) |
of fluid
logging
107
(chapter
apply
to
RFT
the
expected
(air
correlate
wireline
order
30)
be
tools.
drilling process
measurements
or
Timur
Rose
true permeabilities.
that
after
temperature
transition
Raymer
above
reservoir
measurement
tests)
rock
Chevron
(1984)
has
these
of
repeat
the
and
effective
made
These
(1968)
Approximate radius of investigation, feet
brine)
Wyllie
the
zone.
will
(1950)
are:
on
expected
A
produce
caused
and
used
radius
in
conditions).
Freeman
cores,
for
permeability
measurements
relation-
Disparities can
sample
transition
dif-
few
a
formation
reflect
clay
of
Ww
aq
2
2
é
.
=
5
Fr
=
2
c
g
§
3
2
=
S
N
;
10
30
50
0
O
Schlumberger
to
4.
#
Pg
P,
Py
Sw:
In
_
Figure
‘is
.
straight
is
is
is
yield
is
AO
is
THE
‘the
measured
resistivity,
FIGURE 6.12
the
the
the
6.12
linear—that
line
9.93
in
relationship
Schlumberger
see
height
oil
values
is,
in
. ; Permeon, ah 1, x 60 0.0! Gas 3 2 “TTT i SYSTEMS OF ROCK/FLUID 6. 119
gas
PHYSICS
a
in
water
of
fractional
15
transition
fractional
4,
shows
above
O-m/ft
&.
transition
a
?,
40
. | ——__| .005
feet
density
chapter
density
the
zone
in
density
7)
in
Well Services.
porosity
transition
zone,
from
in
—__|
graphic
20
irreducible
g/cc
and
g/cc
02
the
2.5
Porosity,
g/cc
zone.
a resistivity log on a
transition
Permeability Estimation
then
water
5
A
The
iN
/
free-water
eee
|
p.u.
25
/
04
200
zone;
above
10
@
resistivity
level
:
Met
related
the
/
goo
06
to
20
saturation
to
and
A
resistivity
4
is first normalized by division
&
y
68
30
/
linear scale will
the
~~
/
S.-
Midarcig 5
12°?
gradient
to
top
are
is
rr
gradient
Z
representation
provided
£2
L
0
4
Oe
Transition Zone.
35
of the
-
s
that
2
4000
£2
70°
~~
the
(AR/AD)
frequently showa
by R, (the wet rock
crossplotted
commonly
of the Wyllie and Rose
Courtesy
2002 SL
20
40
400