
Page 140 - Open-Hole Log Analysis and Formation Evaluation
P. 140
S0-+----- tc
more
enn --- +t—-
+
ee- Foc een +--+ ----- tae Hee tow
rt
t
at
+
nt
en pe es Herren
oO
45-4 %
a
40-4 \
oe
ae
9Z1 25-+
D%
® * Sw = Constant On 4 3 3 4 — Sw %* > | |
10-4 1 ft
1
.
te,
.
;
Hyperbola for ~ ~Saturas;
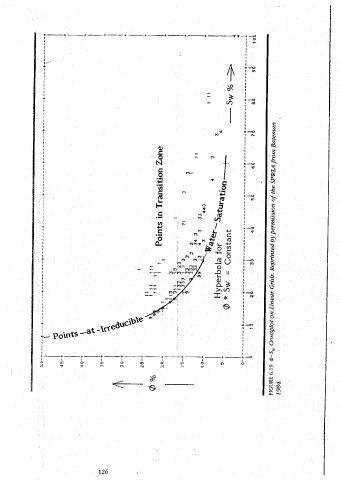
FIGURE 6.19 $-S,, Crossplot on,Linear Grids. Reprinted by permission of the SPWLA from Bateman
1984.
Straight line for
*: Sw = Constant:
L
0% »
uD tf Zero Water Production
coe tie ! tt | :
Noma +t + ! !
s hood “| d
te 1 44 !
t+— t |
{ | |
tt # *
n = x
FIGURE 6.20 $-S,, Crossplot on Logarithmic Grids. Reprinted by permission of the SPWLA from
Bateman 1984.