
Page 153 - Open-Hole Log Analysis and Formation Evaluation
P. 153
FIGURE
7.4
A
CINGHE
SD
(FEET)
a
Neutron-Density Porosity Log.
: DEPTH 139 OF RESULTS APPLICATION Il. METHODS OF ANALYSIS AND 138
Oe
_ On Rock Matrix Porosity Clean Sand 7.
is
(1
Sy
the
and
: BASIC CONCEPTS
This
R,in
-
:
.
5320
=
Same,
from
shale
a
figure
On
Water
FIGURE
0
around
the
to
log
given
From
WATER
ignored.
we
S$,,);
7.5
occupied
7.3,
water
to
and
(33-36%)
the
QUESTION
by
is
40%.
can
we
5350
equation
Porosity
and
60%
porosity curve
#7.2
,
(Ro/R)*.
light
chapter
ft.-
example
saturation
appears
seen
can
¢ =
the
- -
can
Both
by water
6,
is
hydrocarbon
saturation
example
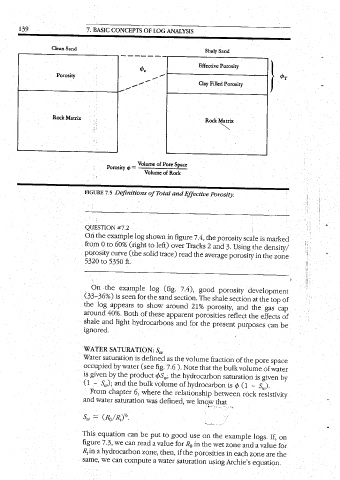
Definitions
be
compute
read
the product
SATURATION:
(see
a
was
zone,
put
where
S,,
these
fig.
shown
defined
left)
to
$5,,;
the
as
. and hydrocarbons of around to show sand section, for the (fig. 7.4), log trace) (the solid to (right figure log Volume of Rock of Pore Space Volume “7 - e PS — OF LOG ANALYSIS
a value
in
water
7.6
then,
bulk volume
the
).
defined,
for
the
over
good
read
Ry
if the
apparent
we
Note
for
use
in
21%
. Effective
the
7.4,
Tracks
saturation
volume
the
that
The
2
on
the
relationship
know
good
. present porosities porosity, shale porosity average and 3. the Rock Matrix Clay Filled Porosity Porosity Shaly Sand
hydrocarbon
the
the
wet
porosities
of hydrocarbon
that
;
is
in
of Total and Effective Porosity.
fraction
between
zone
reflect
and
each
using Archie’s
Using
section
example
saturation
of the
porosity
.
¢(1--
rock
and a
at
porosity scale
the
is
bulk volume
the
in
the
zone
is
purposes.
logs.
the
pore
S,).
the
gas
are
If,
value
given
effects
top
equation.
the
space
oy
for
on
resistivity
by
of water
cap
development
can.be
density/
marked
zone
of
of
o
: