
Page 149 - Open-Hole Log Analysis and Formation Evaluation
P. 149
to
of
of
this
this
Our
and
Low
also
four
1
Sw
Let
Good
hapters
On
Track
20
no
sifting
space.
shows
coding
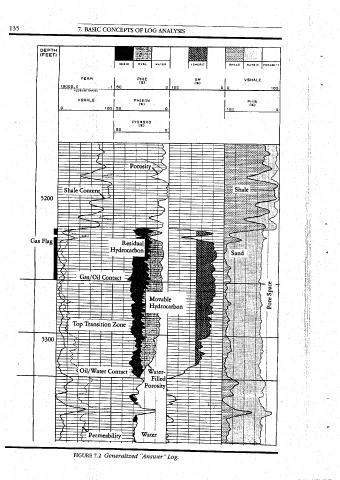
FIGURE
for
=
volume
1
Relative
logs.
sort
bottom,
porosity
with
showing
SP
us
know
chapters
porosity
step
available
the
a
7.1
saturation
Acre
transition
=
by
containing
tracks.
9g
ofSand
discard
Conjains
gamma
starting
that
of the
and
From
and
only
and
%
for
can
Our
that
Billion
LITHOLOGY
water
further
less
shows
about
zone
ray
Reservoir Rocks
review
the
be
both
foll
shows a
data
from
porosity
From
trace
.
Surface
these
the
a
separation
calculation
“answer”
those
splitting
the
follow
than
Grains
,
review
shale
making
left
will
it
leads
and
point will
development
shale
:
gas
how
of
interest
four
Area
log
will
a
further
to
be
be
of the
saturation
will
steps
50%;
,
of
permeability
logged
into
cap
into
as
to
will
:
log
add
a
Sand
distribution
sections
content
:
that
tracks,
section
Reservoir Perspective.
right:
and
and
accomplished
(i.e.,
of resistivity
decisions
be
of figure
three
Track
cover
and
the
attention
an
| —cContains—>
that
4
water
many
by
the
column.
inspect
the
analyst
permeability.
|
follows:
went
all
7.2,
over a
of fluids
oil
about
the
are
‘
All
curves
hydrocarbon
the
shales
the
The
gives
the
into
depth
,
analyst
taking
of
a
the
highlights
column.
a
parts
within
and
porous
4 Gallon
components,
section
basic
may
column.
refinements
logged
we
;
criteria
permeability;
Flat
reserves.
the
The
and
High
nonreservoir
column
picture
evolving
do
that
SP
completion
proceeds when
sand,
Stacked
marker
log
steps
necessary
an
of
pore
intervals
used
Below
has
deduce
Track
is
not
and
evaporites
column,
2
pen
for
shows
interest—that
rocks).
the
gamma
all
the
a
shale,
with
ra
permeable
space;
been
As
is,
want.
studying
he
a
this
answer
and
from
oil
with
a
resistivity
a
bulk
and
divided
involved;
testing
shows
Nonreservoir Rocks
log
top
information
leg,
Track
gas flag;
those
visual
rule,
the
the
pore
zero
needs
Zones
color
and
logged
is
suite
3
water
into
section
a
to
of
rock
curves
:
:
i
.
"
Top.
FIGURE
PERM.
.
VSHALE
:
.
.
i
ce
:
7.2.
Oil/Water
. . G=20% ae Oil Een 1 Cubic Foot 7. BASIC CONCEPTS 135 . OF RESULTS APPLICATION METHODS OF ANALYSIS AND Il. 134
-
*
Permeability
Transition Zone
Contact
: | (x) PHI#SXO (x) PHISSW Powe OF LOG ANALYSIS
Generalized
Hydrocarbon
Residual
Water
Filled
0
Movable
“Answer” Log.
Hydrocarbon
Sw
' sae
on
.
Pore Space VSHALE poe