
Page 219 - Open-Hole Log Analysis and Formation Evaluation
P. 219
204
o
o
o
HH
Ht
PH
_
II.
the
total
also
gives
made
coded
ranging
task
to
reduced
contents
minerals
potassium
of
useful
in
three
area
gamma
are
litho-density
from
assist
black
and
OPEN-HOLE
ray
in
figure
photoelectric
the
tool,
mineral
ratios,
thorium/potassium.
shales,
mapped
indicators.
curve
10.14.
plots
LOGGING
as
represents
A
mineral
highest
a
Track
of
3
the
low
absorption
Uranium
the
together
U
potassium-feldspar
by
to
gives
thorium
function
sort
If additional
with
a
Th
a
itself
MEASUREMENTS
identification.
data
formations
coefficient
uranium/potassium,
may
of their
content.
shown
tatio,
coded
are
in
(P,)
with
for
presentation.
uranium-free
thorium
display
indicate
both
figure
to bauxite, A number
a
available,
on
plots
and
obtained
example,
Other elemental
for
the
curve.
10.15
with
thorium/uranium,
which
from
ratios
can
Track
highest
the
2
high organic
indicates
and
of radioactive
be
the
are
potassium
example,
205
CGR
(GAP ID
10.
THE
GAMMA
RAY LOG
40.00
j0.0
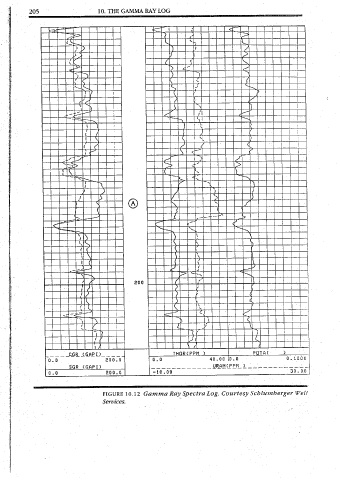
, Services. a Track 1 shows such of one gives an example 10.16 FIGURE 10.12 Gamma Ray Spectra Log. Courtesy Figure K) already computed. (U, Th,.and three components of the ratios curve by offering identification the of minerals in a number potassium ratio thorium to of the variation the 10.13 illustrates Figure method. called the geochemical ~ could b
. Schlumberger Well