
Page 220 - Open-Hole Log Analysis and Formation Evaluation
P. 220
oO
g
e
x
r
=
=
6
§
6
e
&
0
84
44
124
0
Fe
£
ae
9
ce
<
=
3
T © a a § g | E 164 5 wv & sy 2 x 04 u g © FIGURE women UI. 206
<
&
i
“
Io",
2
[§:/
w
ss
©
FIGURE
1
x
Courtesy
RS
e@
1.0
10.14
10.13
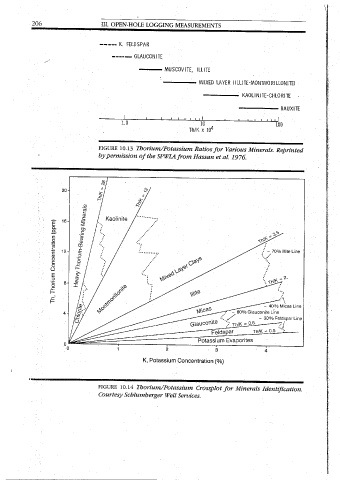
by permission
gy
4
&/
1 | mceewe GLAUCONITE FELDSPAR K. OPEN-HOLE
K,
Y
y
i
:
Schlumberger
.
2
Na
" THK 10 peop iit 1 —_———— : MUSCOVITE, ILLITE LOGGING MEASUREMENTS
e
Potassium
ae
ek
Thorium/Potassium
Thorium/Potassium
Ww
oes
Well Services.
ae
S
x
mice
aS
.
Concentration
104
of the SPWLA from Hassan
Giauconité
\
(3
Ratios for
(%)
Potassium
et al.
Crossplot for
Feldspar
=<
“
po L . / KAOLINITE-CHLORITE MIXED LAYER (ILLITE-MONTMORILLONI .
“aK
=
1976.
Evaporites
0.6
Minerals
~
ThiK
J
7
,
:
~
=
74
*s
~
Lo
aeltZ
Various Minerals.
nis
40%
80% Glauconite Line
9
100
/
0.5"
2%
Identification.
30% Feldspar Line
po
:
: Micas Line 70% Illite Line ane Reprinted 7 ' BAUXITE TED 207
8
e
“3
2
a
5
2
4
4 |
j
04
: 3 6 2 Oo 44 9 8 oO 4 2 I § 6 = S| < G S| ] 4 B EB = } | to 0 g 2 oo 4 4 4 2 Oo 44 4 g g 1 4 BOY 4 3 s i 2 {Chlorite 5 q $ 2 ad 1 € 4 105 10.
po
: . 2LSomite
ma
: 2 Montmorillonite La THE
2
,
berger
FIGURE
Ray
3
10.15
Spectra
6
.
Well Services.
.
: 4 , GAMMA RAY LOG
K,
-
4.
°
Crossplots.
Glauconite
2
(a)
P,
| M uscovile | [To i J Biotite Potassium Concentration (%) ° Glauconite
|
3
us.
Iilite
Photoelectric Absorption
/ : Montmorillonite Mixed 6 INite
K.
6.
ThIK, Thorium-Potassium
(b)
‘
P,
Ratio
10
vs.
don,
Coefficient
: o Layer , 5
. y Th/K. (P,) 20° Chiorite
a
Raoinne
30
: ! i -—_Muscovlte Biotite
i
Courtesy
: i
and Natural
60
|
Schlum-
Gam-
100
10,
*
i
4 | . :
~