
Page 27 - Optical Communications Essentials
P. 27
Basic Concepts of Communication Systems
Basic Concepts of Communication Systems 17
TABLE 1.5. Representative Values of Decibel
Power Loss and the Remaining Percentages
Percentage of
Power loss, dB power left
0.1 98
0.5 89
1 79
2 63
3 50
6 25
10 10
20 1
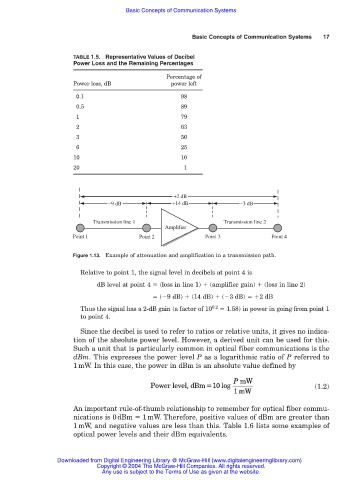
+2 dB
−9 dB +14 dB −3 dB
Transmission line 1 Transmission line 2
Amplifier
Point 1 Point 2 Point 3 Point 4
Figure 1.13. Example of attenuation and amplification in a transmission path.
Relative to point 1, the signal level in decibels at point 4 is
dB level at point 4 (loss in line 1) (amplifier gain) (loss in line 2)
( 9 dB) (14 dB) ( 3 dB) 2 dB
Thus the signal has a 2-dB gain (a factor of 10 0.2 1.58) in power in going from point 1
to point 4.
Since the decibel is used to refer to ratios or relative units, it gives no indica-
tion of the absolute power level. However, a derived unit can be used for this.
Such a unit that is particularly common in optical fiber communications is the
dBm. This expresses the power level P as a logarithmic ratio of P referred to
1mW. In this case, the power in dBm is an absolute value defined by
P mW
Power level, dBm 10 log (1.2)
1mW
An important rule-of-thumb relationship to remember for optical fiber commu-
nications is 0dBm 1mW. Therefore, positive values of dBm are greater than
1mW, and negative values are less than this. Table 1.6 lists some examples of
optical power levels and their dBm equivalents.
Downloaded from Digital Engineering Library @ McGraw-Hill (www.digitalengineeringlibrary.com)
Copyright © 2004 The McGraw-Hill Companies. All rights reserved.
Any use is subject to the Terms of Use as given at the website.