
Page 26 - Optical Communications Essentials
P. 26
Basic Concepts of Communication Systems
16 Chapter One
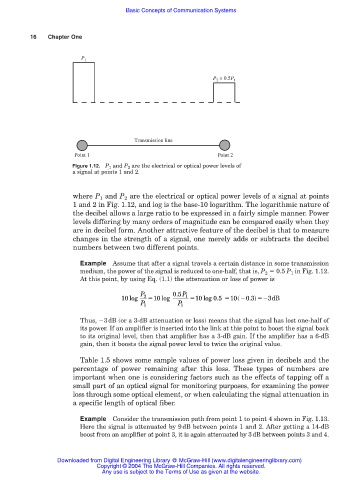
P 1
P 2 = 0.5P 1
Transmission line
Point 1 Point 2
Figure 1.12. P 1 and P 2 are the electrical or optical power levels of
a signal at points 1 and 2.
where P 1 and P 2 are the electrical or optical power levels of a signal at points
1 and 2 in Fig. 1.12, and log is the base-10 logarithm. The logarithmic nature of
the decibel allows a large ratio to be expressed in a fairly simple manner. Power
levels differing by many orders of magnitude can be compared easily when they
are in decibel form. Another attractive feature of the decibel is that to measure
changes in the strength of a signal, one merely adds or subtracts the decibel
numbers between two different points.
Example Assume that after a signal travels a certain distance in some transmission
medium, the power of the signal is reduced to one-half, that is, P 2 0.5 P 1 in Fig. 1.12.
At this point, by using Eq. (1.1) the attenuation or loss of power is
P 0.5P
10 log 2 10 log 1 10 log 0.5 10( 0.3) 3dB
P 1 P 1
Thus, 3dB (or a 3-dB attenuation or loss) means that the signal has lost one-half of
its power. If an amplifier is inserted into the link at this point to boost the signal back
to its original level, then that amplifier has a 3-dB gain. If the amplifier has a 6-dB
gain, then it boosts the signal power level to twice the original value.
Table 1.5 shows some sample values of power loss given in decibels and the
percentage of power remaining after this loss. These types of numbers are
important when one is considering factors such as the effects of tapping off a
small part of an optical signal for monitoring purposes, for examining the power
loss through some optical element, or when calculating the signal attenuation in
a specific length of optical fiber.
Example Consider the transmission path from point 1 to point 4 shown in Fig. 1.13.
Here the signal is attenuated by 9dB between points 1 and 2. After getting a 14-dB
boost from an amplifier at point 3, it is again attenuated by 3dB between points 3 and 4.
Downloaded from Digital Engineering Library @ McGraw-Hill (www.digitalengineeringlibrary.com)
Copyright © 2004 The McGraw-Hill Companies. All rights reserved.
Any use is subject to the Terms of Use as given at the website.