
Page 123 - Optical Switching And Networking Handbook
P. 123
06_200023_CH05/Batesx 1/17/01 8:19 AM Page 108
108 Chapter 5
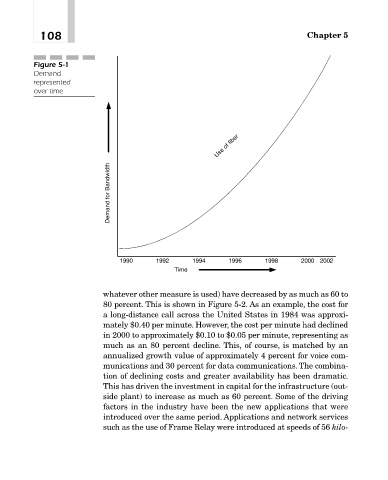
Figure 5-1
Demand
represented
over time
Use of fiber
Demand for Bandwidth
1990 1992 1994 1996 1998 2000 2002
Time
whatever other measure is used) have decreased by as much as 60 to
80 percent. This is shown in Figure 5-2. As an example, the cost for
a long-distance call across the United States in 1984 was approxi-
mately $0.40 per minute. However, the cost per minute had declined
in 2000 to approximately $0.10 to $0.05 per minute, representing as
much as an 80 percent decline. This, of course, is matched by an
annualized growth value of approximately 4 percent for voice com-
munications and 30 percent for data communications. The combina-
tion of declining costs and greater availability has been dramatic.
This has driven the investment in capital for the infrastructure (out-
side plant) to increase as much as 60 percent. Some of the driving
factors in the industry have been the new applications that were
introduced over the same period. Applications and network services
such as the use of Frame Relay were introduced at speeds of 56 kilo-