
Page 130 - Optofluidics Fundamentals, Devices, and Applications
P. 130
110 Cha pte r S i x
10 μm
(a) 525 (b)
0.8
Normalized frequency (α/λ) 0.6 Wavelength (nm) 500 Bandedge1
0.7
0.5
0.4
0.3
475
0.2
L-gap center
0.1
0.0 450 Bandedge2
X U L Γ X W K 1.0 1.1 1.2 1.3 1.4 1.5
(c) Refractive index (n )
bg
(d)
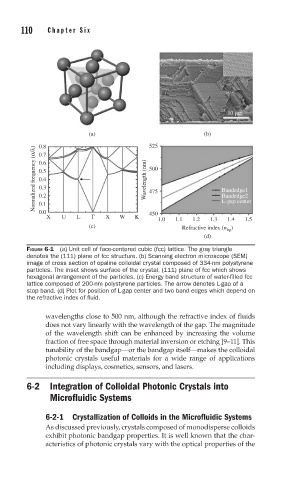
FIGURE 6-1 (a) Unit cell of face-centered cubic (fcc) lattice. The gray triangle
denotes the (111) plane of fcc structure. (b) Scanning electron microscope (SEM)
image of cross section of opaline colloidal crystal composed of 334-nm polystyrene
particles. The inset shows surface of the crystal, (111) plane of fcc which shows
hexagonal arrangement of the particles. (c) Energy band structure of water-fi lled fcc
lattice composed of 200-nm polystyrene particles. The arrow denotes L-gap of a
stop band. (d) Plot for position of L-gap center and two band edges which depend on
the refractive index of fl uid.
wavelengths close to 500 nm, although the refractive index of fluids
does not vary linearly with the wavelength of the gap. The magnitude
of the wavelength shift can be enhanced by increasing the volume
fraction of free space through material inversion or etching [9–11]. This
tunability of the bandgap—or the bandgap itself—makes the colloidal
photonic crystals useful materials for a wide range of applications
including displays, cosmetics, sensors, and lasers.
6-2 Integration of Colloidal Photonic Crystals into
Microfluidic Systems
6-2-1 Crystallization of Colloids in the Microfluidic Systems
As discussed previously, crystals composed of monodisperse colloids
exhibit photonic bandgap properties. It is well known that the char-
acteristics of photonic crystals vary with the optical properties of the