
Page 188 - Optofluidics Fundamentals, Devices, and Applications
P. 188
Optofluidic Photonic Crystal Fibers: Pr operties and Applications 163
also changes the dispersion profile, and the bandpass filters we
described earlier also function as tunable delay lines [122]. The reso-
nant nature of the PBGF modal dispersion enables one to achieve zero
or anomalous dispersion at short wavelengths (Fig. 7-22c) [123,124]
without the need for a small-core and high-index contrast as with
index-guided fibers. Fluidic PBGFs then offer an attractive platform for
investigating nonlinear pulse propagation at wavelengths below
1 μm [60,125]. In Fig. 7-23 we show that for femtosecond pulse
Input pulse
n = 1.62 n = 1.64 1.0 0.5 kW
D
D
2.7 kW
Intensity (a.u.) 0.6
1.0 0.8 4.1 kW
0.5 Normal 0.4
0.2
Intensity (a.u.) 1.0 Zero –200 –100 Delay (fs) 100 200
0.0
0
0.5
(b)
380
1.5
Anomalous
1.0 385
0.5 SH-Wavelength (nm)
0.0 390
740 760 780 800 820 840 860
Wavelength (nm) 395
(a)
–600 –300 0 300 600
Time delay (fs)
(c)
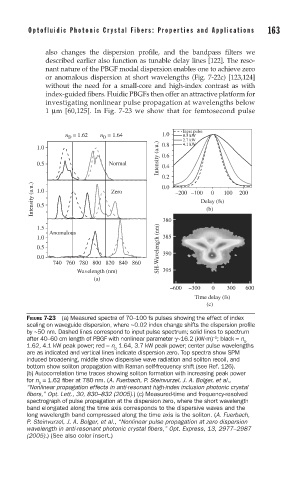
FIGURE 7-23 (a) Measured spectra of 70–100 fs pulses showing the effect of index
scaling on waveguide dispersion, where ~0.02 index change shifts the dispersion profi le
by ~50 nm. Dashed lines correspond to input pulse spectrum; solid lines to spectrum
−1
after 40–60 cm length of PBGF with nonlinear parameter γ~16.2 (kW·m) ; black = n
D
1.62, 4.1 kW peak power; red = n 1.64, 3.7 kW peak power; center pulse wavelengths
D
are as indicated and vertical lines indicate dispersion zero. Top spectra show SPM
induced broadening, middle show dispersive wave radiation and soliton recoil, and
bottom show soliton propagation with Raman self-frequency shift (see Ref. 126).
(b) Autocorrelation time traces showing soliton formation with increasing peak power
for n = 1.62 fi ber at 780 nm. (A. Fuerbach, P. Steinvurzel, J. A. Bolger, et al.,
D
“Nonlinear propagation effects in anti-resonant high-index inclusion photonic crystal
fi bers,” Opt. Lett., 30, 830–832 (2005).) (c) Measured-time and frequency-resolved
spectrograph of pulse propagation at the dispersion zero, where the short wavelength
band elongated along the time axis corresponds to the dispersive waves and the
long wavelength band compressed along the time axis is the soliton. (A. Fuerbach,
P. Steinvurzel, J. A. Bolger, et al., “Nonlinear pulse propagation at zero dispersion
wavelength in anti-resonant photonic crystal fi bers,” Opt. Express, 13, 2977–2987
(2005).) (See also color insert.)