
Page 187 - Optofluidics Fundamentals, Devices, and Applications
P. 187
162 Cha pte r Se v e n
demonstrated in Ref. [116], making them competitive with surface
plasmon resonance sensors [134]. The dispersive properties of the
fiber modes also determine the width of the rejection band (band-
width inversely proportional to the group index difference of the cou-
pled modes [118]), and in order to achieve a narrow rejection band,
one must design the fiber around that goal [119]. PBGFs inherently
have the necessary dispersive properties for narrow-band coupling,
and a rejection bandwidth of 1.1 nm is shown in Fig. 7-21b [114].
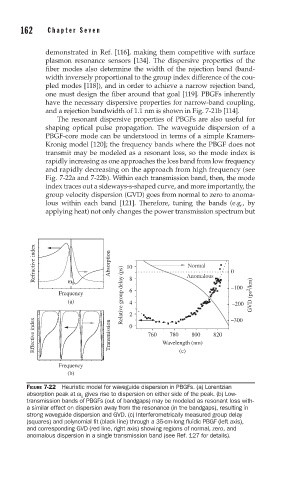
The resonant dispersive properties of PBGFs are also useful for
shaping optical pulse propagation. The waveguide dispersion of a
PBGF-core mode can be understood in terms of a simple Kramers-
Kronig model [120]; the frequency bands where the PBGF does not
transmit may be modeled as a resonant loss, so the mode index is
rapidly increasing as one approaches the loss band from low frequency
and rapidly decreasing on the approach from high frequency (see
Fig. 7-22a and 7-22b). Within each transmission band, then, the mode
index traces out a sideways-s-shaped curve, and more importantly, the
group velocity dispersion (GVD) goes from normal to zero to anoma-
lous within each band [121]. Therefore, tuning the bands (e.g., by
applying heat) not only changes the power transmission spectrum but
Refractive index Absorption 10 Anomalous 0
Normal
ω
0
Frequency Relative group delay (ps) 8 6 –100 GVD (ps 2 /km)
(a) 4 2 2 –200
Effective index Transmission 0 760 Wavelength (nm) 820 –300
800
780
Frequency (c)
(b)
FIGURE 7-22 Heuristic model for waveguide dispersion in PBGFs. (a) Lorentzian
absorption peak at ω gives rise to dispersion on either side of the peak. (b) Low-
0
transmission bands of PBGFs (out of bandgaps) may be modeled as resonant loss with-
a similar effect on dispersion away from the resonance (in the bandgaps), resulting in
strong waveguide dispersion and GVD. (c) Interferometrically measured group delay
(squares) and polynomial fi t (black line) through a 35-cm-long fl uidic PBGF (left axis),
and corresponding GVD (red line, right axis) showing regions of normal, zero, and
anomalous dispersion in a single transmission band (see Ref. 127 for details).