
Page 182 - Optofluidics Fundamentals, Devices, and Applications
P. 182
Optofluidic Photonic Crystal Fibers: Pr operties and Applications 157
this is found to adjust the surface energy of silica so that the water
meniscus contact angle is close to the desired 90 degrees. Figure 7-18
shows the flattening effect of the organosilane layer on the water
meniscus in the square capillary.
The now flat meniscus is moved using pressure applied from a
syringe coupled to the square capillary using silicone rubber tubing
sealed with epoxy. A video microscope is used to track the position of
the meniscus. The SMF probe is connected to a thermal halogen
broadband white light source with a wavelength range of 1.0 to
1.8 μm while the collection SMF is connected to an OSA. Figure 7-18
shows the device transmission as the meniscus is pushed across the
beam. The transmission starts out spectrally flat, and then develops a
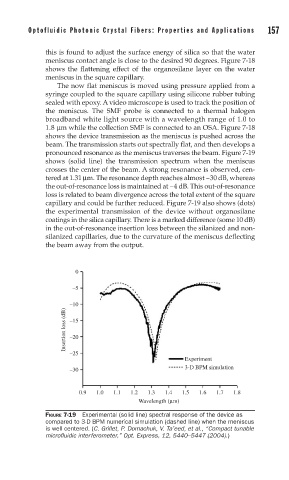
pronounced resonance as the meniscus traverses the beam. Figure 7-19
shows (solid line) the transmission spectrum when the meniscus
crosses the center of the beam. A strong resonance is observed, cen-
tered at 1.31 μm. The resonance depth reaches almost −30 dB, whereas
the out-of-resonance loss is maintained at −4 dB. This out-of-resonance
loss is related to beam divergence across the total extent of the square
capillary and could be further reduced. Figure 7-19 also shows (dots)
the experimental transmission of the device without organosilane
coatings in the silica capillary. There is a marked difference (some 10 dB)
in the out-of-resonance insertion loss between the silanized and non-
silanized capillaries, due to the curvature of the meniscus deflecting
the beam away from the output.
0
–5
–10
Insertion loss (dB) –15
–20
–25
Experiment
3-D BPM simulation
–30
0.9 1.0 1.1 1.2 1.3 1.4 1.5 1.6 1.7 1.8
Wavelength (μm)
FIGURE 7-19 Experimental (solid line) spectral response of the device as
compared to 3-D BPM numerical simulation (dashed line) when the meniscus
is well centered. (C. Grillet, P. Domachuk, V. Ta’eed, et al., “Compact tunable
microfl uidic interferometer,” Opt. Express, 12, 5440–5447 (2004).)