
Page 95 - Organic Electronics in Sensors and Biotechnology
P. 95
72 Cha pte r T w o
–1 0.8
CO N 2 CO N 2 CO N 2
–2 500 ppb 1 ppm 3.75 ppm
2.5 ppm 5 ppm 0.6
–3
500 ppb
250 ppb 1 ppm 1.5 ppm
I ds (μA) –4 2 ppm Normalized response 0.4
–5
NO 2 0.2
–6 NO
–7
400 600 800 1000 1200 1400 1600 100 150 200 250 300 350 400
Time (s) Time (s)
(a) (b)
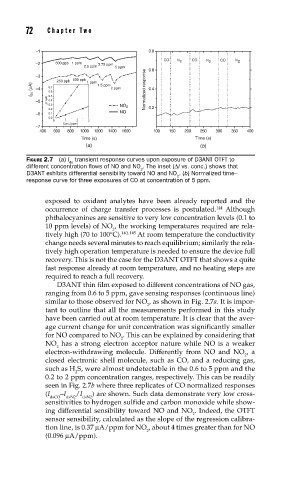
FIGURE 2.7 (a) I transient response curves upon exposure of D3ANT OTFT to
ds
different concentration fl ows of NO and NO . The inset (ΔI vs. conc.) shows that
2
D3ANT exhibits differential sensibility toward NO and NO . (b) Normalized time–
2
response curve for three exposures of CO at concentration of 5 ppm.
exposed to oxidant analytes have been already reported and the
occurrence of charge transfer processes is postulated. Although
144
phthalocyanines are sensitive to very low concentration levels (0.1 to
10 ppm levels) of NO , the working temperatures required are rela-
2
tively high (70 to 100°C). 140, 145 At room temperature the conductivity
change needs several minutes to reach equilibrium; similarly the rela-
tively high operation temperature is needed to ensure the device full
recovery. This is not the case for the D3ANT OTFT that shows a quite
fast response already at room temperature, and no heating steps are
required to reach a full recovery.
D3ANT thin film exposed to different concentrations of NO gas,
ranging from 0.6 to 5 ppm, gave sensing responses (continuous line)
similar to those observed for NO , as shown in Fig. 2.7a. It is impor-
2
tant to outline that all the measurements performed in this study
have been carried out at room temperature. It is clear that the aver-
age current change for unit concentration was significantly smaller
for NO compared to NO . This can be explained by considering that
2
NO has a strong electron acceptor nature while NO is a weaker
2
electron-withdrawing molecule. Differently from NO and NO , a
2
closed electronic shell molecule, such as CO, and a reducing gas,
such as H S, were almost undetectable in the 0.6 to 5 ppm and the
2
0.2 to 2 ppm concentration ranges, respectively. This can be readily
seen in Fig. 2.7b where three replicates of CO normalized responses
(I –I /I ) are shown. Such data demonstrate very low cross-
dsCO dsN2 dsN2
sensitivities to hydrogen sulfide and carbon monoxide while show-
ing differential sensibility toward NO and NO . Indeed, the OTFT
2
sensor sensibility, calculated as the slope of the regression calibra-
tion line, is 0.37 μA/ppm for NO , about 4 times greater than for NO
2
(0.096 μA/ppm).