
Page 96 - Organic Electronics in Sensors and Biotechnology
P. 96
Or ganic Thin-Film Transistors for Inor ganic Substance Monitoring 73
The I –V transfer characteristics in N and at different concentra-
ds g 2
tions of NO were measured as well. The transfer characteristics are
2
the I curves measured as a function of V , keeping V constant at −40 V.
ds g ds
Such an operating regime, already used in previous works, 146, 56 allows
one to extract multiparametric information to fully investigate the
gas sensing properties of the active layer. Besides, since the device is
driven in the depletion regimes before each measurement run,
response repeatability is seen to improve. The I –V curve transfer
70
ds g
characteristics were taken alternatively in N atmosphere and in
2
streams of different concentrations of NO . The scan rate allowed
2
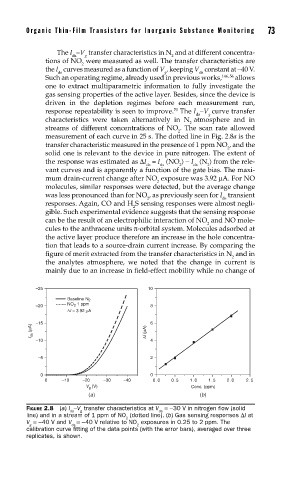
measurement of each curve in 25 s. The dotted line in Fig. 2.8a is the
transfer characteristic measured in the presence of 1 ppm NO , and the
2
solid one is relevant to the device in pure nitrogen. The extent of
the response was estimated as ΔI = I (NO ) − I (N ) from the rele-
ds ds 2 ds 2
vant curves and is apparently a function of the gate bias. The maxi-
mum drain-current change after NO exposure was 3.92 μA. For NO
2
molecules, similar responses were detected, but the average change
was less pronounced than for NO , as previously seen for I transient
2 ds
responses. Again, CO and H S sensing responses were almost negli-
2
gible. Such experimental evidence suggests that the sensing response
can be the result of an electrophilic interaction of NO and NO mole-
2
cules to the anthracene units π-orbital system. Molecules adsorbed at
the active layer produce therefore an increase in the hole concentra-
tion that leads to a source-drain current increase. By comparing the
figure of merit extracted from the transfer characteristics in N and in
2
the analytes atmosphere, we noted that the change in current is
mainly due to an increase in field-effect mobility while no change of
–25 10
Baseline N 2
–20 ------- NO 2 1 ppm 8
ΔI = 3.92 μA
–15 6
I ds (μA) ΔI (μA)
–10 4
–5 2
0 0
0 –10 –20 –30 –40 0.0 0.5 1.0 1.5 2.0 2.5
V g (V) Conc. (ppm)
(a) (b)
FIGURE 2.8 (a) I –V transfer characteristics at V =−30 V in nitrogen fl ow (solid
ds g ds
line) and in a stream of 1 ppm of NO (dotted line). (b) Gas sensing responses ΔI at
2
V =−40 V and V =−40 V relative to NO exposures in 0.25 to 2 ppm. The
g ds 2
calibration curve fi tting of the data points (with the error bars), averaged over three
replicates, is shown.