
Page 187 - Origin and Prediction of Abnormal Formation Pressures
P. 187
162 W.H. FERTL, G.V. CHILINGAR AND J.O. ROBERTSON JR.
2 -
4 -
i
6 AHFP top fro
0 ~-~ sonic log ~
0
0 8
i
r lo
c~ ~, Max. temp. = 167~ Q~
I P = 17,000 x 0.433 = 7370 psi i1~
12 - G = 0.767
mud weight = 14.7 Ib/gal
Kick
14 -
mud weight ranged I
from 11.3 to 14.5 Ib/gal i I
i~ Equivalent temperature for
16
i. normal conditions at 1 7,000 ft.
d
18 t , I I,i , I I I , , I . t . I . .I
40 60 80 100 100 200 300 2 4 6 8 1/0
Ats~, l~sec/ft Temperature, ~ Formation Pressure,
1000 psi
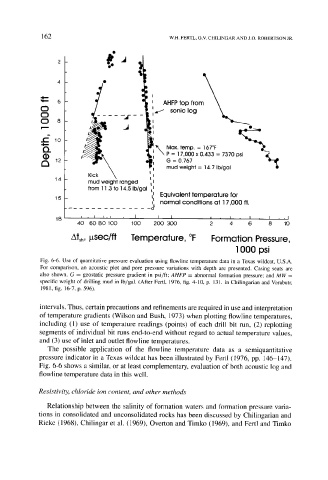
Fig. 6-6. Use of quantitative pressure evaluation using flowline temperature data in a Texas wildcat, U.S.A.
For comparison, an acoustic plot and pore pressure variations with depth are presented. Casing seats are
also shown. G = geostatic pressure gradient in psi/ft; AHFP = abnormal formation pressure; and MW =
specific weight of drilling mud in lb/gal. (After Fertl, 1976, fig. 4-10, p. 131. In Chilingarian and Vorabutr,
1981, fig. 16-7, p. 596).
intervals. Thus, certain precautions and refinements are required in use and interpretation
of temperature gradients (Wilson and Bush, 1973) when plotting flowline temperatures,
including (1) use of temperature readings (points) of each drill bit run, (2) replotting
segments of individual bit runs end-to-end without regard to actual temperature values,
and (3) use of inlet and outlet flowline temperatures.
The possible application of the flowline temperature data as a semiquantitative
pressure indicator in a Texas wildcat has been illustrated by Fertl (1976, pp. 146-147).
Fig. 6-6 shows a similar, or at least complementary, evaluation of both acoustic log and
flowline temperature data in this well.
Resistivity, chloride ion content, and other methods
Relationship between the salinity of formation waters and formation pressure varia-
tions in consolidated and unconsolidated rocks has been discussed by Chilingarian and
Rieke (1968), Chilingar et al. (1969), Overton and Timko (1969), and Fertl and Timko