
Page 183 - Origin and Prediction of Abnormal Formation Pressures
P. 183
15 8 W.H. FERTL, G.V. CHILINGAR AND J.O. ROBERTSON JR.
Porosity, % Pore Pressure, "A" Exponent,
5o o~8 Ib/gal 8~8 Ib/gal a
|,, J I I
g__
Bit
#27
Bit I
~ #28 9%i0.
#29
Bit
t
Bit
#31
o
o
c)
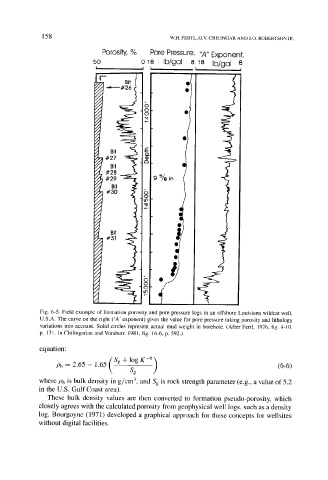
Fig. 6-5. Field example of formation porosity and pore pressure logs in an offshore Louisiana wildcat well,
U.S.A. The curve on the right ('A' exponent) gives the value for pore pressure taking porosity and lithology
variations into account. Solid circles represent actual mud weight in borehole. (After Fertl, 1976, fig. 4-10,
p. 131. In Chilingarian and Vorabutr, 1981, fig. 16-6, p. 592.)
equation:
Pb--2.65--1 65(Sg+l~
9 Sg (6-6)
where Pb is bulk density in g/cm 3, and Sg is rock strength parameter (e.g., a value of 5.2
in the U.S. Gulf Coast area).
These bulk density values are then converted to formation pseudo-porosity, which
closely agrees with the calculated porosity from geophysical well logs, such as a density
log. Bourgoyne (1971) developed a graphical approach for these concepts for wellsites
without digital facilities.