
Page 178 - Origin and Prediction of Abnormal Formation Pressures
P. 178
0[ A B
DRILLING PARAMETERS 153
o4[ \
o
..ff
e,-
12-
' I I f ' I I I t I
1.O 2.0 3,0 0,5 1.O 2,5
d- exponent d o - exponent
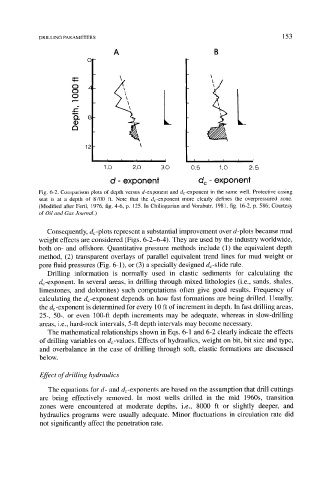
Fig. 6-2. Comparison plots of depth versus d-exponent and de-exponent in the same well. Protective casing
seat is at a depth of 8700 ft. Note that the de-exponent more clearly defines the overpressured zone.
(Modified after Fertl, 1976, fig. 4-6, p. 125. In Chilingarian and Vorabutr, 1981, fig. 16-2, p. 586; Courtesy
of Oil and Gas Journal.)
Consequently, de-plots represent a substantial improvement over d-plots because mud
weight effects are considered (Figs. 6-2-6-4). They are used by the industry worldwide,
both on- and offshore. Quantitative pressure methods include (1) the equivalent depth
method, (2) transparent overlays of parallel equivalent trend lines for mud weight or
pore fluid pressures (Fig. 6-1), or (3) a specially designed de-slide rule.
Drilling information is normally used in elastic sediments for calculating the
de-exponent. In several areas, in drilling through mixed lithologies (i.e., sands, shales,
limestones, and dolomites) such computations often give good results. Frequency of
calculating the d~-exponent depends on how fast formations are being drilled. Usually,
the d~-exponent is determined for every 10 ft of increment in depth. In fast drilling areas,
25-, 50-, or even 100-ft depth increments may be adequate, whereas in slow-drilling
areas, i.e., hard-rock intervals, 5-ft depth intervals may become necessary.
The mathematical relationships shown in Eqs. 6-1 and 6-2 clearly indicate the effects
of drilling variables on d~-values. Effects of hydraulics, weight on bit, bit size and type,
and overbalance in the case of drilling through soft, elastic formations are discussed
below.
Effect of drilling hydraulics
The equations for d- and de-exponents are based on the assumption that drill cuttings
are being effectively removed. In most wells drilled in the mid 1960s, transition
zones were encountered at moderate depths, i.e., 8000 ft or slightly deeper, and
hydraulics programs were usually adequate. Minor fluctuations in circulation rate did
not significantly affect the penetration rate.