Page 180 - Origin and Prediction of Abnormal Formation Pressures
P. 180

DRILLING PARAMETERS                                                   155
                                      m
                                      0
                                    E  :
                                    Or-
                                8   -
                                            O
                                    9.0
                                    9.3      e~,  9
                                    9.5  00
                                       9.2   9
                                    9"39.5   ~~           "'"s
                                9-  9.6   Oo

                                                               01   o
                                                                9
                          0                      o~            ~176 9
                          0
                          0
                          ~-   SO
                                   10.3       o                o
                          c-
                          ,4--"
                          Q.       13'814"3      ~                i
                          (!.)     14.615.1   -&/
                          a        15.515.6,.o   t    9    9  9
                                    15.515.5a
                                    16.0       9       9   9
                               11  -   16.2


                               12                 9 A    o A
                                    16.9
                                        .
                                    .....  I .....  I   I   i   I     I
                                 0.5   1.0   1.5   0.5   1.0   1.5   2.0
                                    d  - exponent     do - exponent
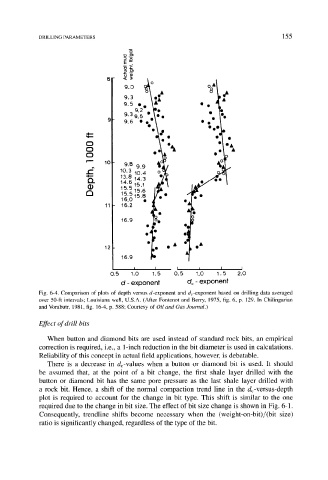
            Fig.  6-4.  Comparison of plots of depth versus d-exponent and dc-exponent based on drilling data averaged
            over 50-ft intervals;  Louisiana well, U.S.A.  (After Fontenot and Berry,  1975, fig. 6, p.  129. In Chilingarian
            and Vorabutr, 1981, fig. 16-4, p. 588; Courtesy of Oil and Gas Journal.)

            Effect of drill bits

               When  button  and  diamond  bits  are  used  instead  of  standard  rock  bits,  an  empirical
            correction  is required,  i.e.,  a  1-inch reduction  in the bit diameter is used  in calculations.
            Reliability of this concept in actual field applications,  however,  is debatable.
               There  is  a  decrease  in  dc-values  when  a  button  or  diamond  bit  is  used.  It  should
            be  assumed  that,  at  the  point  of  a  bit  change,  the  first  shale  layer  drilled  with  the
            button  or  diamond  bit  has  the  same  pore  pressure  as  the  last  shale  layer  drilled  with
            a  rock  bit.  Hence,  a  shift  of  the  normal  compaction  trend  line  in  the  de-versus-depth
            plot  is  required  to  account  for  the  change  in  bit  type.  This  shift  is  similar  to  the  one
            required  due to the change  in bit size. The effect of bit size change  is  shown in Fig.  6-1.
            Consequently,  trendline  shifts  become  necessary  when  the  (weight-on-bit)/(bit  size)
            ratio is significantly changed,  regardless  of the type of the bit.
   175   176   177   178   179   180   181   182   183   184   185