
Page 202 - Origin and Prediction of Abnormal Formation Pressures
P. 202
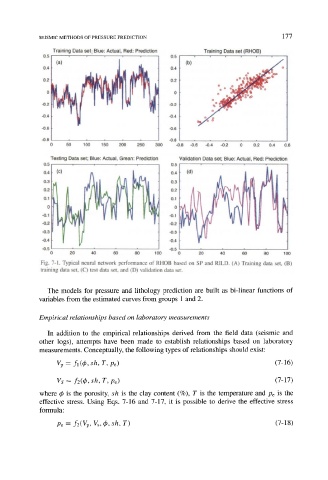
SEISMIC METHODS OF PRESSURE PREDICTION                                177

               Training  Data set;  Blue:  Actual,  Red:  Prediction   Training  Data set  (RHOB)
             0.5   ......   ,   '   . . . .  *  .  .  .  .  .  .  ,   . . . . . . .  ~   .............   0.5   .......   _~   y~   .......  ,  ...............   ,   ..........   ,  ..........   ,  .............   ,   .....
                (a)
             0.4                                 0.4   (b)             o ~   o ~ =  o
             0.2                                 0.2
                                                               o   o  R~= 8'JLe=Ar
                                                               o  o  O==o.~,.j~  -"o  o
                                                               0
            -0.2                                 -0.2         0   0  '  r  -   0
                                                             o   o
            -0.4                                 -0.4    ,  Oog
            -0.6                                 -0.6
            -0.8                                 -0.8
               0   50   1 O0   150   200   250   300   -0.8   -0.6   -0.4   -0.2   0   0.2   0.4   0.6

               Testing  Data set; Blue: Actual,  Grean:  Prediction   Validation  Data  set;  Blue:  Actual,  Red:  Prediction
             0.5  ......................  9 ..............  9  ......  ,  .....   9   ...........   0.5
             0.4                                 0.4
             0.3                                 0.3
             0.2                                 0.2
             0,1                                 0.I
              0                                   0
            -0.1                                 .0.1
            .0.2                                 .0.2
            .0.3                                 ..0.3
            -0.4                                 -0.4
             -0.5                 ....................................... 0.5
               0    20     40    60    80    100    0     20    40    60    80    100
            Fig.  7-1.  Typical  neural  network  performance  of  RHOB  based  on  SP  and  RILD.  (A)  Training  data  set,  (B)
            training  data  set,  (C) test  data  set,  and  (D)  validation  data  set.

               The  models  for  pressure  and  lithology  prediction  are  built  as  bi  linear  functions  of
            variables from the estimated curves from groups  1 and 2

            Empirical relationships based on laboratory measurements

               In  addition  to  the  empirical  relationships  derived  from  the  field  data  (seismic  and
            other  logs),  attempts  have  been  made  to  establish  relationships  based  on  laboratory
            measurements.  Conceptually,  the following types of relationships  should exist:
                 Vp -  A@,sh,  T, Pe)                                           (7-16)

                 Vs  --  fz(~b, sh,  T, Pe)                                     (7-17)
            where  4~ is  the  porosity,  sh  is  the  clay  content  (%),  T  is  the  temperature  and  Pe  is  the
            effective  stress.  Using  Eqs.  7-16  and  7-17,  it  is  possible  to  derive  the  effective  stress
            formula:

                 Pe  --  fz(Vp,  Vs, ~b, sh,  T)                                (7-18)