
Page 207 - Origin and Prediction of Abnormal Formation Pressures
P. 207
182 E AMINZADEH, G.V. CHILINGAR AND J.O. ROBERTSON JR.
v A V
-p
urated zone
v B v
-p
sured zone
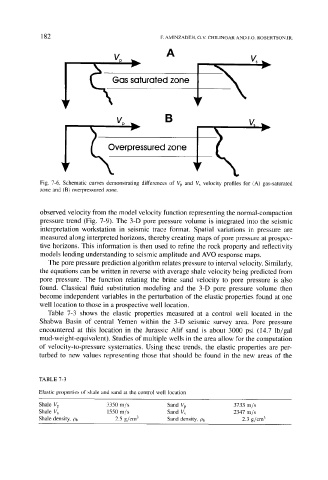
Fig. 7-6. Schematic curves demonstrating differences of Vp and Vs velocity profiles for (A) gas-saturated
zone and (B) overpressured zone.
observed velocity from the model velocity function representing the normal-compaction
pressure trend (Fig. 7-9). The 3-D pore pressure volume is integrated into the seismic
interpretation workstation in seismic trace format. Spatial variations in pressure are
measured along interpreted horizons, thereby creating maps of pore pressure at prospec-
tive horizons. This information is then used to refine the rock property and reflectivity
models lending understanding to seismic amplitude and AVO response maps.
The pore pressure prediction algorithm relates pressure to interval velocity. Similarly,
the equations can be written in reverse with average shale velocity being predicted from
pore pressure. The function relating the brine sand velocity to pore pressure is also
found. Classical fluid substitution modeling and the 3-D pore pressure volume then
become independent variables in the perturbation of the elastic properties found at one
well location to those in a prospective well location.
Table 7-3 shows the elastic properties measured at a control well located in the
Shabwa Basin of central Yemen within the 3-D seismic survey area. Pore pressure
encountered at this location in the Jurassic Alif sand is about 3000 psi (14.7 lb/gal
mud-weight-equivalent). Studies of multiple wells in the area allow for the computation
of velocity-to-pressure systematics. Using these trends, the elastic properties are per-
turbed to new values representing those that should be found in the new areas of the
TABLE 7-3
Elastic properties of shale and sand at the control well location
Shale Vp 3350 m/s Sand Vp 3733 m/s
Shale Vs 1550 m/s Sand Vs 2347 m/s
Shale density, ,Ob 2.5 g/cm 3 Sand density, Pb 2.3 g/cm 3