
Page 205 - Origin and Prediction of Abnormal Formation Pressures
P. 205
] 80 E AMINZADEH, G.V. CHILINGAR AND J.O. ROBERTSON JR.
P .... Pore Pressure Images
(PPg) =nn
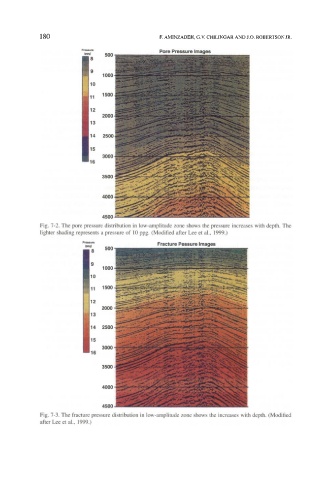
Fig. 7-2. The pore pressure distribution in low-amplitude zone shows the pressure increases with depth. The
lighter shading represents a pressure of 10 ppg. (Modified after Lee et al., 1999.)
P""u~' Fracture Pessure Images
(PPg) ~^^ . . . . . .
m8
Fig. 7-3. The fracture pressure distribution in low-amplitude zone shows the increases with depth. (Modified
after Lee et al., 1999.)